Composite Images
I recently responded to a tweet about a preprint about whether people can see Dark Triad traits (narcissism, Machiavellianism, and psychopathy) in facial appearance.
Can you tell a Dark Triad person from the face? Apparently so (data from USA and Turkey). https://t.co/BxZUcJ9cTY pic.twitter.com/xh1pcmyB5E
— David Schmitt (@PsychoSchmitt) January 27, 2020
The preprint by Alper, Bayrak, and Yilmaz used faces from the Faceaurus database (Holtzman, 2011). “Holtzman (2011) standardized the assessment scores, computed average scores of self- and peer-reports, and ranked the face images based on the resulting scores. Then, prototypes for each of the personality dimensions were created by digitally combining 10 faces with the highest and 10 faces with the lowest scores on the personality trait in question (Holtzman, 2011).” This was done separately for male and female faces.
Since scores on the three dark triad traits are positively correlated, the three pairs of composite faces are not independent. Indeed, Holtzman states that 5 individuals were in all three low composites for the male faces, while the overlap was less extreme in other cases. With 105 observers, Holtzman found that the ability to detect the composite higher in a dark triad trait was greater than chance.
While I commend both Holtzman and Alper, Bayrak, and Yilmaz for their transparency, data sharing, and material sharing, I am arguing that this test has an effective N of 2, and that further replications using these images, such as those done by Alper, Bayrak, and Yilmaz, regardless of number of observers or preregistered status, lend no further weight of evidence to the assertion that dark triad traits are visible in physical appearance.
Women’s height
Let’s go back to my favourite example for demonstrating the problems with aggregating ratings before analysis, Armenian women’s height. The problem is the same here, but we’ve just averaged the stimuli before rating, rather than averaging the ratings of individual stimuli.
First, we’re going to simulate a sample of 20 women from a population with a mean height of 158.1 cm and an SD of 5.7. Half are born on odd days and half on even days.
set.seed(8675309)

stim_n <- 10
height_m <- 158.1
height_sd <- 5.7

odd <- rnorm(stim_n, height_m, height_sd)
even <- rnorm(stim_n, height_m, height_sd)

t.test(odd, even)
##
## Welch Two Sample t-test
##
## data: odd and even
## t = 1.7942, df = 17.409, p-value = 0.09016
## alternative hypothesis: true difference in means is not equal to 0
## 95 percent confidence interval:
## -0.7673069 9.5977215
## sample estimates:
## mean of x mean of y
## 161.1587 156.7435A t-test shows no significant difference, which is unsurprising. We simulated the data from the same distributions, so we know for sure there is no real difference here. Now we’re going to average the height of the women with odd and even birthdays.
odd_mean <- mean(odd)
even_mean <- mean(even)
So if we create a composite of women born on odd days, she would be 161.2 cm tall, and a composite of women born on even days would be 156.7 cm tall.
If we ask 100 observers to look at these two composites and judge which one looks taller, what do you imagine would happen? Let’s say that observers are pretty bad with height estimation, and their estimates for each composite have error with a standard deviation of 10 cm. They then judge whether, by their estimation, the odd-birthday composite looks taller than the even-birthday composite.
obs_n <-100
error_sd <- 10

odd_estimate <- odd_mean + rnorm(obs_n, 0, error_sd)
even_estimate <- even_mean + rnorm(obs_n, 0, error_sd)

judgment <- odd_estimate > even_estimate

bt <- binom.test(sum(judgment), obs_n, p = 0.5) %>% print()
##
## Exact binomial test
##
## data: sum(judgment) and obs_n
## number of successes = 65, number of trials = 100, p-value = 0.003518
## alternative hypothesis: true probability of success is not equal to 0.5
## 95 percent confidence interval:
## 0.5481506 0.7427062
## sample estimates:
## probability of success
## 0.65A binomial test shows that they are significantly better than chance at this (p = 0.004). What’s going on?
We can be sure that by chance alone, our two composites will be at least slightly different on any measure, even if they are drawn from identical populations. The mean (unsigned) size of this difference is larger, the smaller the number of stimuli that go into each composite. The graph below shows simulations of the unsigned difference between composites for 1000 samples per number of stimuli per composite.
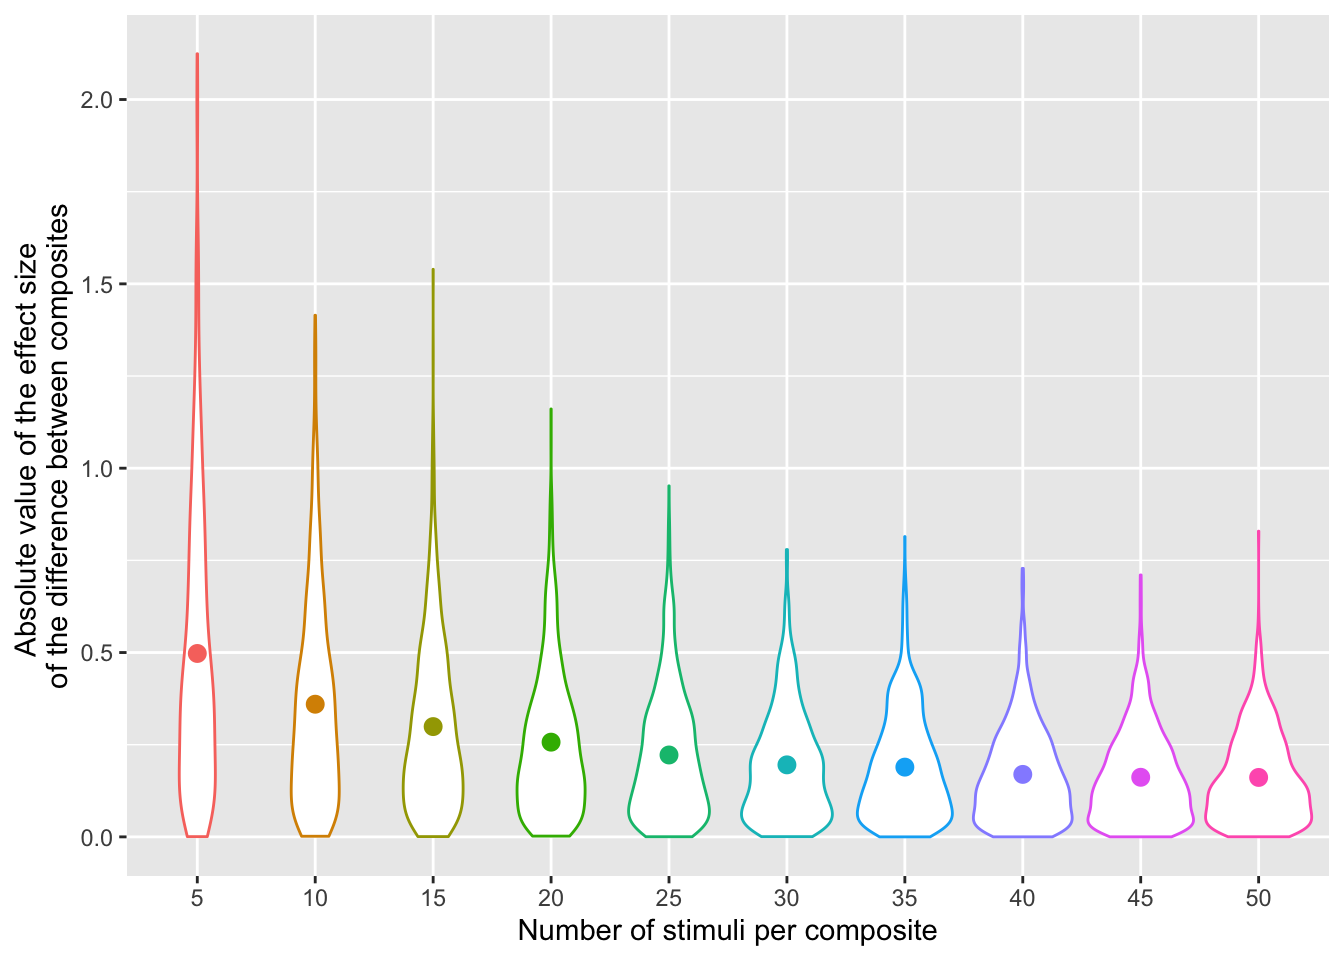
x <- replicate(10000, mean(rnorm(10))-mean(rnorm(10)))With only 10 stimuli per composite, the mean unsigned effect size of the difference between composites is 0.36 (in units of SD of the original trait distribution). 65% of random pairs have a difference of greater than 0.2 SD. If our observers are accurate enough at perceiving this difference or we run a very large number of observers, we are virtually guarateed to find significant results every time, and we have a 50% chance that all of these results will be in the predicted direction.
Personality Traits and Faces
So what does this mean for studies of the link between personality traits and facial appearance? The analogy with birth date and height holds. As long as there are facial morphologies that are even slightly consistently associated with the perception of a trait, then composites will not be identical in that morphology, even if it is totally unassociated with the trait as measured by, e.g., personality scales or peer report.
- The smaller the number of stimuli that go into each composite, the greater the chance that they will be visibly different in morphology related to the judgment of interest, just by chance alone.
- The larger the number of observers or the better observers are at detecting small differences in this morphology, the more likley that “detection” will be significantly above chance.
- Repeating this with a new set of observers does not increase the amount of evidence you have for the association between the face morphology and the measured trait. You’ve only measured it once in one population of faces.
- If observers are your unit of analyses, you are making conclusions about whether the population of observers can detect the difference between your stimuli, you cannot generalise this to new stimulus sets.
References
Alper, S., Bayrak, F., & Yilmaz, O. (2020, January 27). All the Dark Triad and Some of the Big Five Traits are Visible in the Face. https://doi.org/10.31234/osf.io/c3ngz
Holtzman, N. S. (2011). Facing a psychopath: Detecting the dark triad from emotionally-neutral faces, using prototypes from the Personality Faceaurus. Journal of Research in Personality, 45, 648-654. https://doi.org/10.1016/j.jrp.2011.09.002
Lisa DeBruine
Professor of Psychology
Lisa DeBruine is a professor of psychology at the University of Glasgow. Her substantive research is on the social perception of faces and kinship. Her meta-science interests include team science (especially the Psychological Science Accelerator), open documentation, data simulation, web-based tools for data collection and stimulus generation, and teaching computational reproducibility.