library(ggplot2)
library(patchwork)

#devtools::install_github("debruine/quartoExtra")
library(quartoExtra)quartoExtra
The quartoExtra package implements the fixes and additions on this site. Install from GitHub using devtools::install_github("debruine/quartoExtra").
Setup
Project Setup
The dark mode toggle only works for projects with a _quarto.yml file (e.g., books and websites) set up in the right way, with dark and light .scss files. darkmode_setup() is a convenience function that adds the dark and light .scss files (or updates existing ones) and creates/updates the _quarto.yml file to use the light and dark and themes you specify (defaults to flatly and darkly). This should only be done once for each project and in the console, not in a script.
darkmode_setup(light_theme = "cosmo",
               dark_theme = "slate")
Theme setup
You can, however, set the dark and light ggplot themes in scripts.
darkmode_theme_set(
  dark = ggthemes::theme_stata(scheme = "s1rcolor"),
  light = ggthemes::theme_stata(scheme = "s1color")
)
Plots
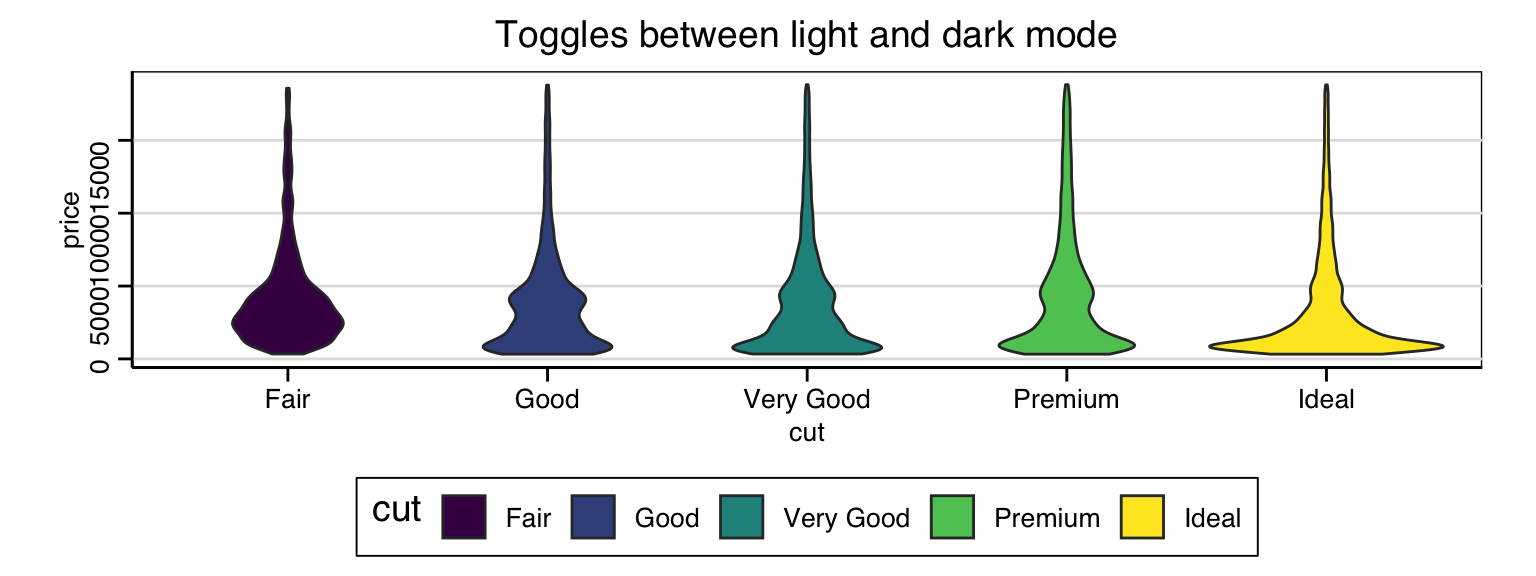
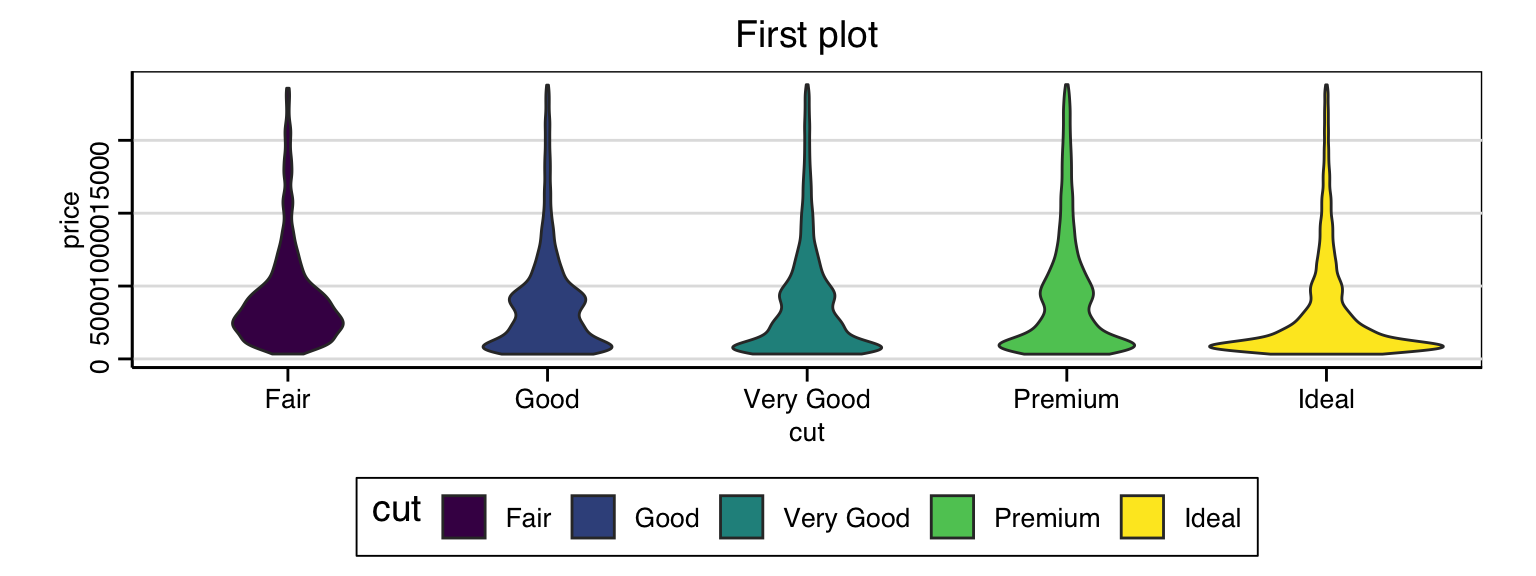
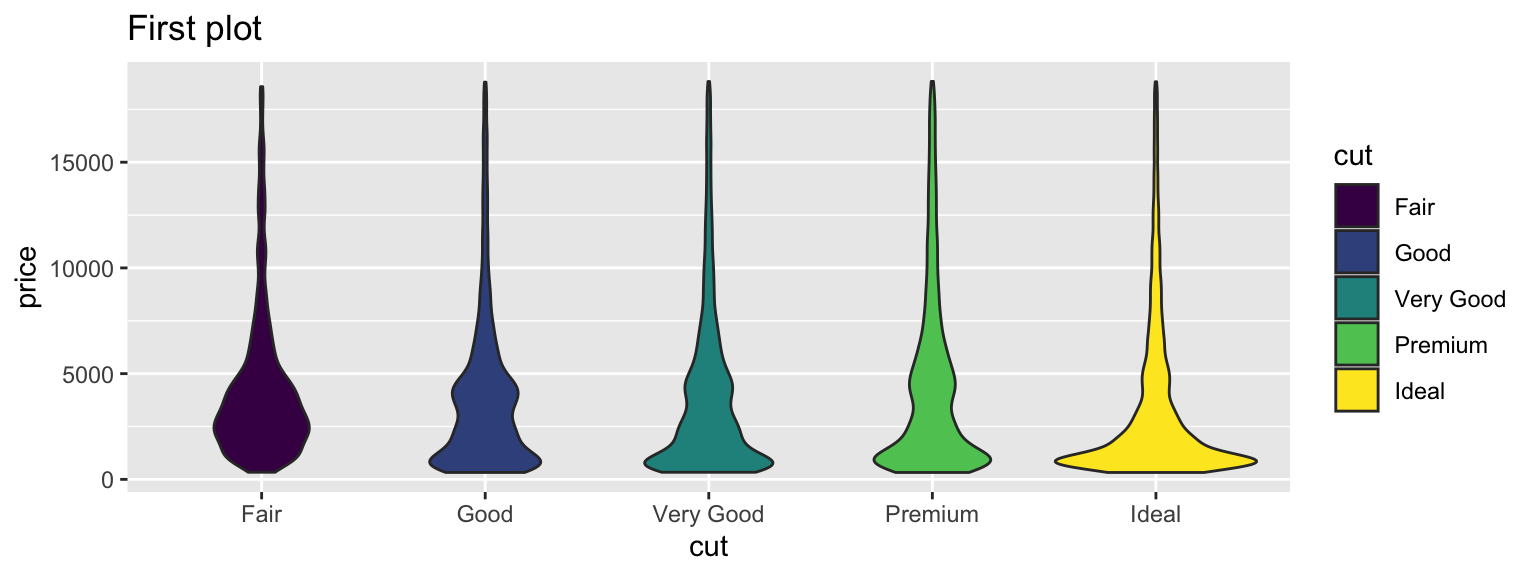
g <- ggplot(diamonds, aes(x = cut, y = price, fill = cut)) +
  geom_violin()
Plots will toggle light and dark mode if you set #| classes: dark-light in the chunk.
g + labs(title = "Toggles between light and dark mode")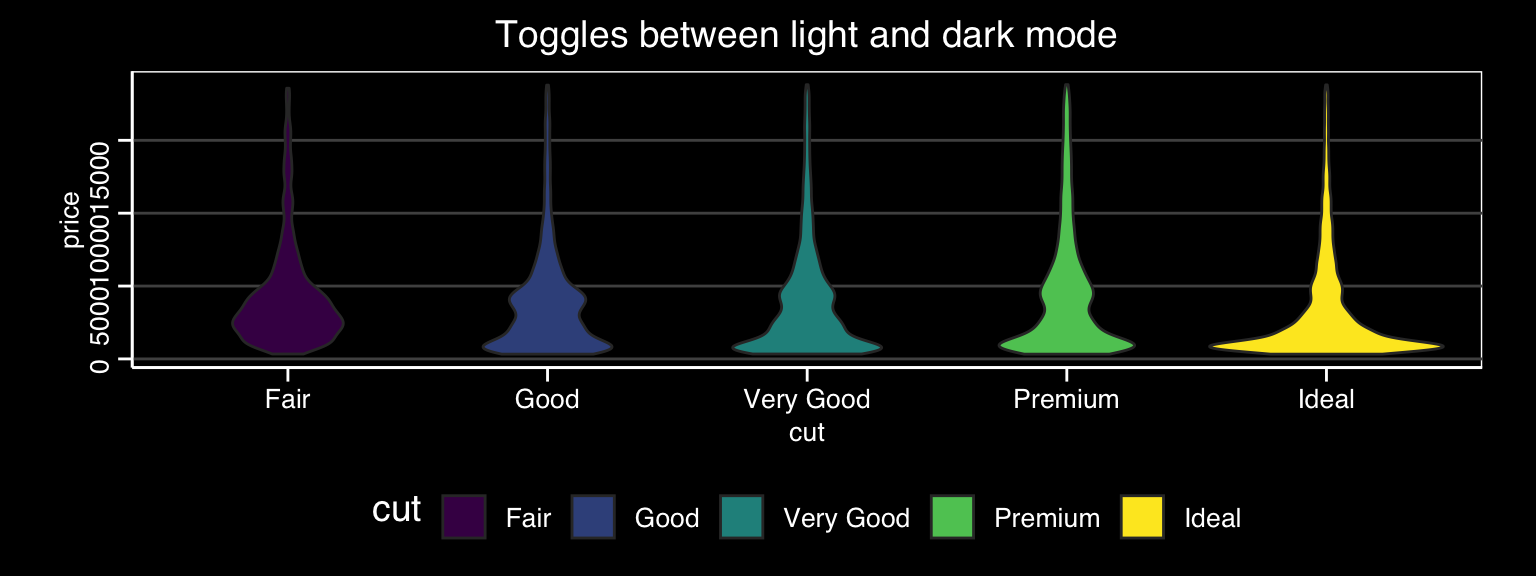
Set classes = "dark-light" in the knitr chunk option defaults if you don’t want to have to type it in each figure chunk.
knitr::opts_chunk$set(
classes = "dark-light",
fig.width = 8,
fig.height = 3
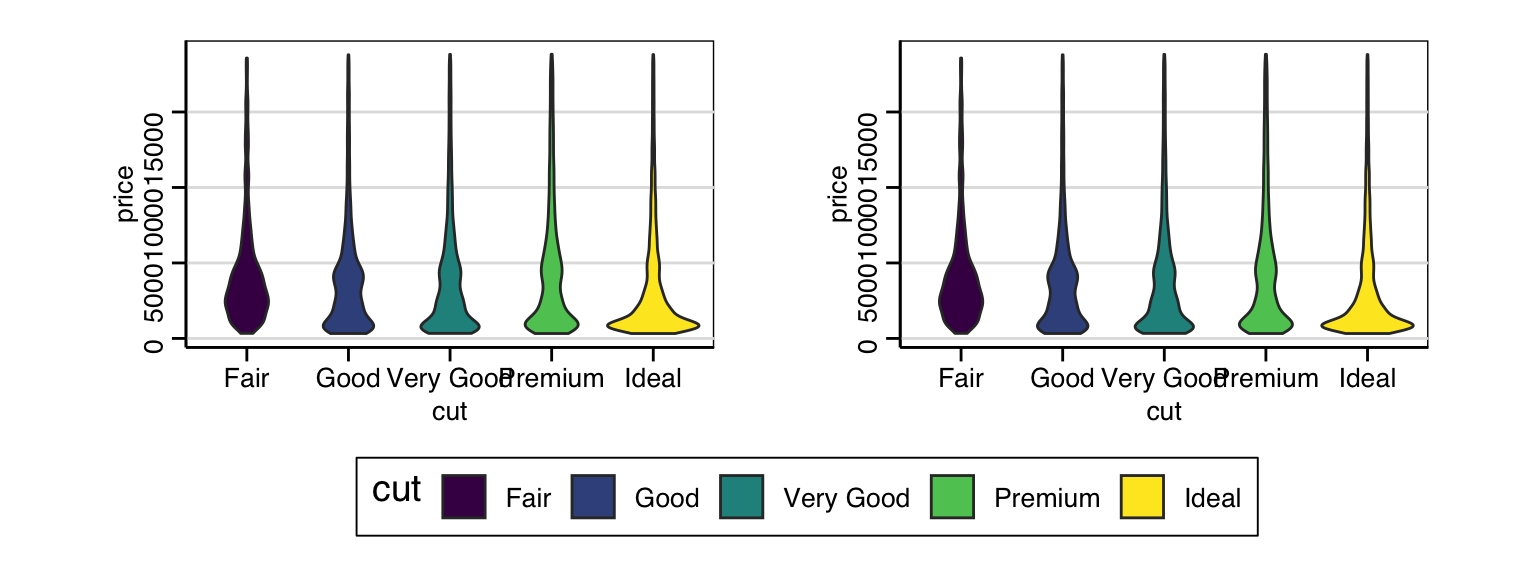
)It also works for patchwork plots, thanks to Marc-Aurèle.
g + g + plot_layout(nrow = 1, guides = "collect")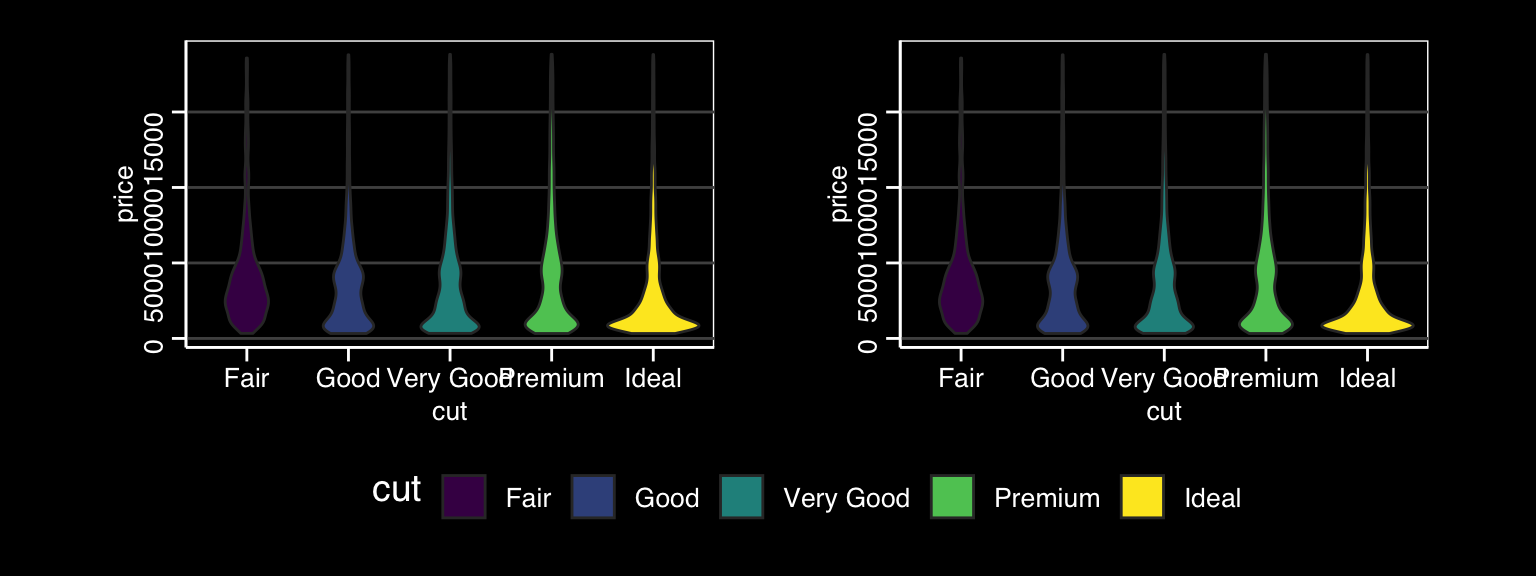
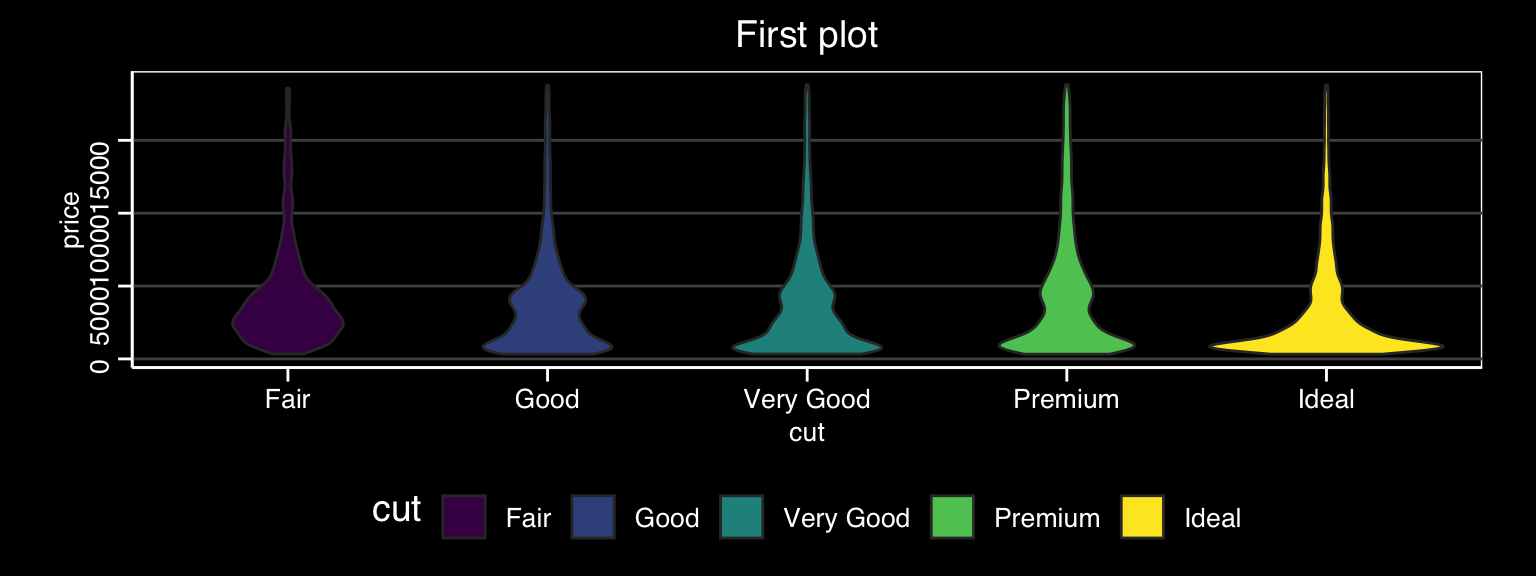
Multiple plots
Multiple plots in a chunk is trickier. It only works if you create the plots separately.
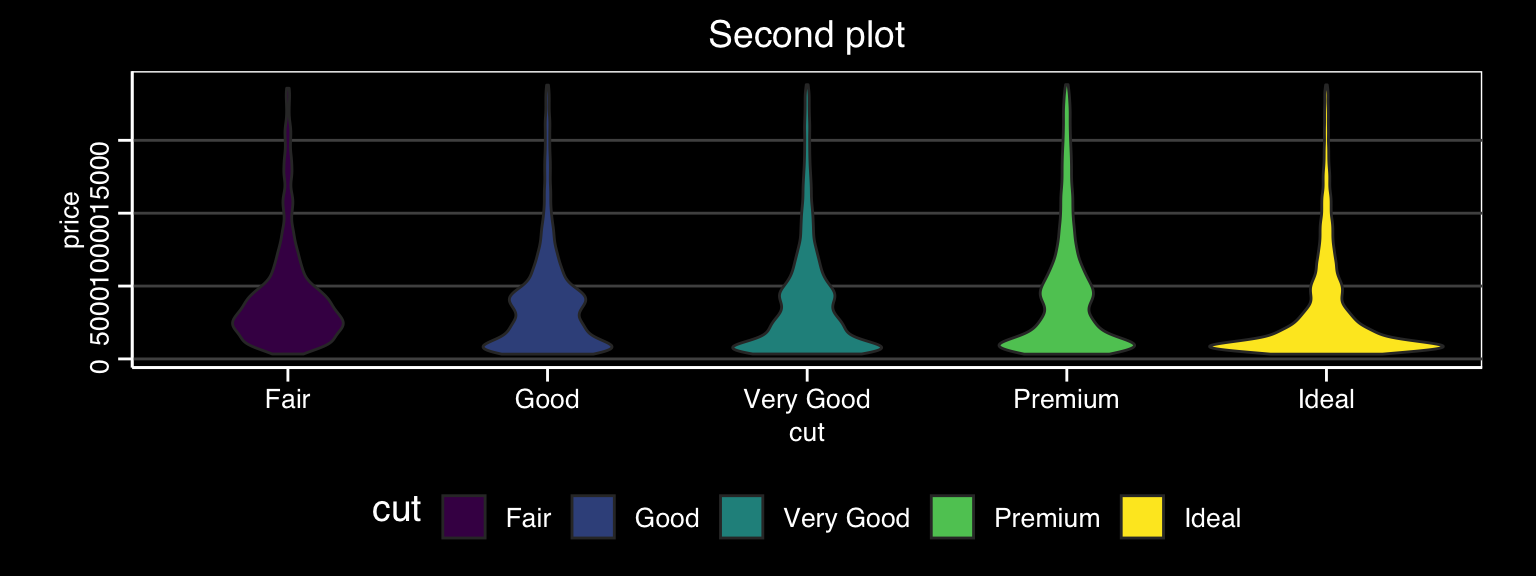
g + labs(title = "First plot")
g + labs(title = "Second plot")


It doesn’t work if you’re making plots in a function or for loop and have to use print() to display them.
titles <- c("First plot",
            "Second plot")
for (title in titles) {
  print(g + labs(title = title))
}

However, this hack makes it work. I’ll work on getting this to happen with the code above.
# works, but is hacky
titles <- c("First plot",
            "Second plot")
for (title in titles) {
  knitr::knit_print(g + labs(title = title),
                    options = knitr::opts_current$get())
}


Dark/Light mode chunks
Your plots might need more customisation than just the dark or light theme, so you can make them in separate code chunks with the class dark-mode or light-mode.
If you add #| classes: light-mode to the chunk, both the chunk source and output will only show in light mode. If you add #| classes: dark-mode to the chunk, both the chunk source and output will only show in dark mode.
g + labs(title = "Only shows in light mode") +
  ggthemes::theme_solarized(light = TRUE)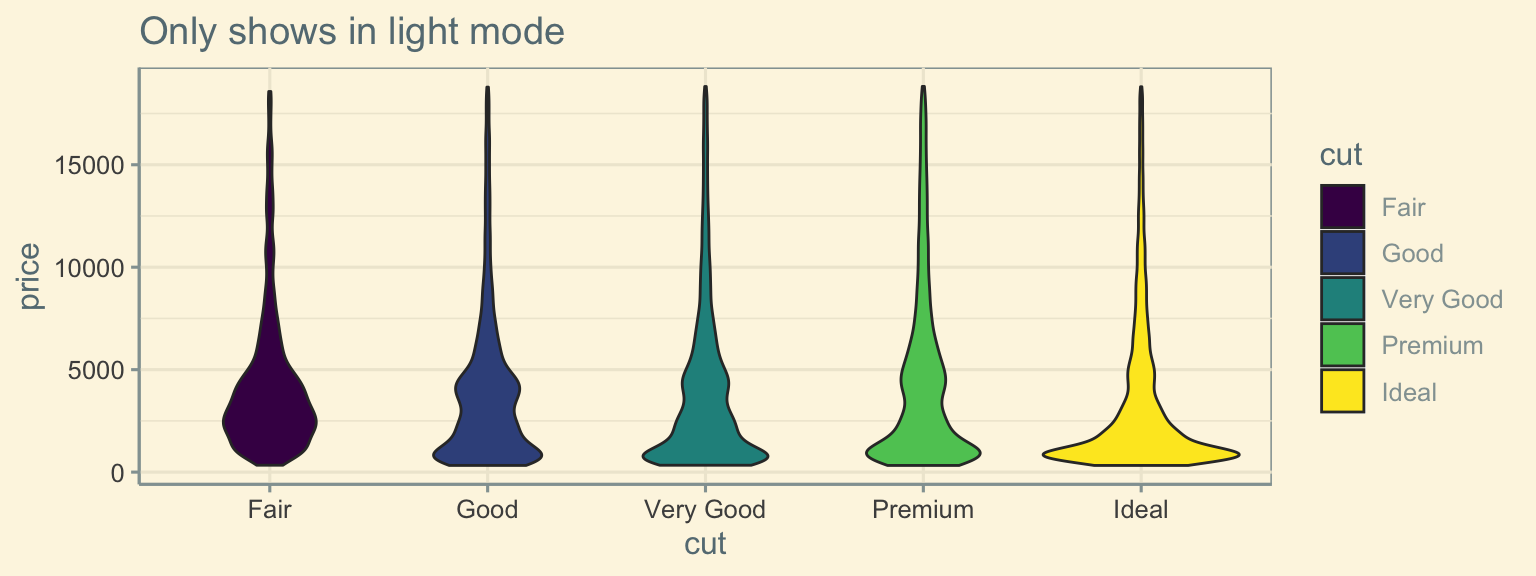
g + labs(title = "Only shows in dark mode") +
  ggthemes::theme_solarized(light = FALSE)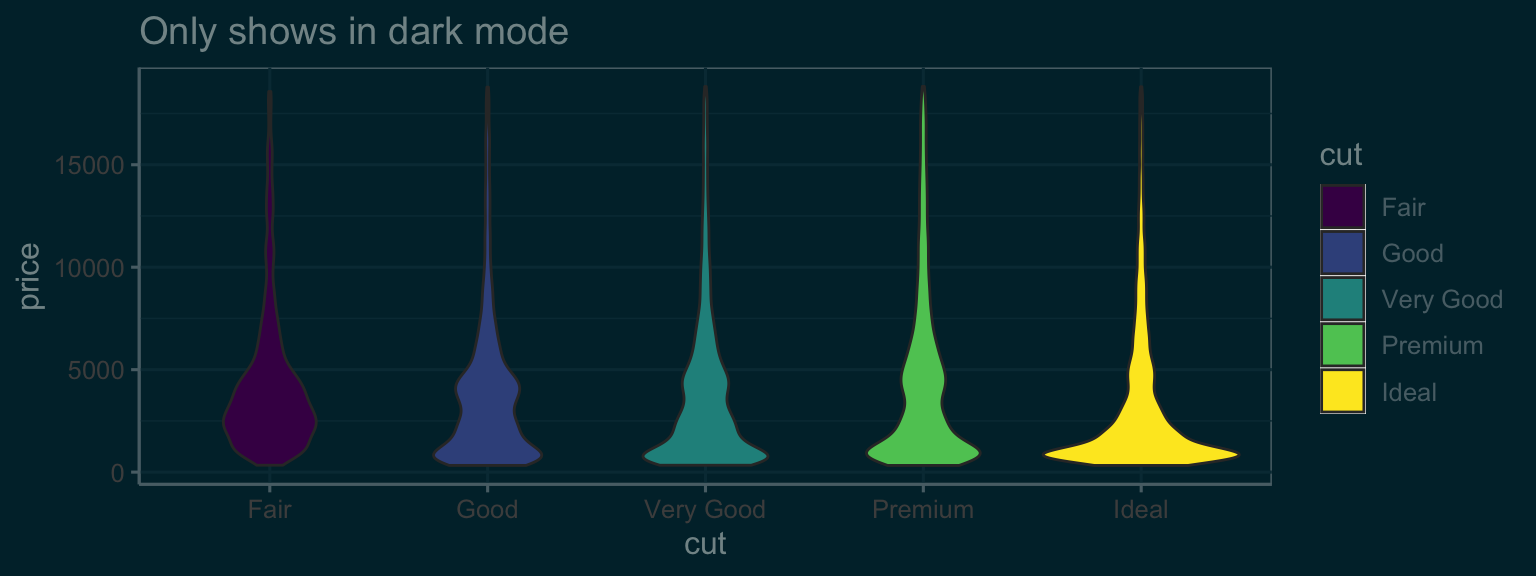
This is also true for non-plot outputs.
data.frame(mode = "light-mode") mode
1 light-modedata.frame(mode = "dark-mode") mode
1 dark-modeNon-code
This also works for non-code content. Just put it inside of a div with the appropriate class.
::: {.light-mode}
Text that only shows in light mode
:::

::: {.dark-mode}
Text that only shows in dark mode
:::
Text that only shows in light mode
Text that only shows in dark mode
Tables
Set the “quartoExtra.df_print” option to render all subsequent tables using kable or as paged tables (more options coming soon).
Default
tbl <- data.frame(
  number = 1:26,
  letter = LETTERS[1:26]
)
# default printing
tbl number letter
1 1 A
2 2 B
3 3 C
4 4 D
5 5 E
6 6 F
7 7 G
8 8 H
9 9 I
10 10 J
11 11 K
12 12 L
13 13 M
14 14 N
15 15 O
16 16 P
17 17 Q
18 18 R
19 19 S
20 20 T
21 21 U
22 22 V
23 23 W
24 24 X
25 25 Y
26 26 ZPaged
options(quartoExtra.df_print = "paged")# print as paged
tblKable
options(quartoExtra.df_print = "kable")# print as kable
tbl| number | letter |
|---|---|
| 1 | A |
| 2 | B |
| 3 | C |
| 4 | D |
| 5 | E |
| 6 | F |
| 7 | G |
| 8 | H |
| 9 | I |
| 10 | J |
| 11 | K |
| 12 | L |
| 13 | M |
| 14 | N |
| 15 | O |
| 16 | P |
| 17 | Q |
| 18 | R |
| 19 | S |
| 20 | T |
| 21 | U |
| 22 | V |
| 23 | W |
| 24 | X |
| 25 | Y |
| 26 | Z |