Plots the specified within and between design. See vignette("plots", package = "faux") for examples and details.
Arguments
- x
A list of design parameters created by check_design() or a data tbl (in long format)
- ...
A list of factor names to determine visualisation (see vignette) in the order color, x, facet row(s), facet col(s)
- geoms
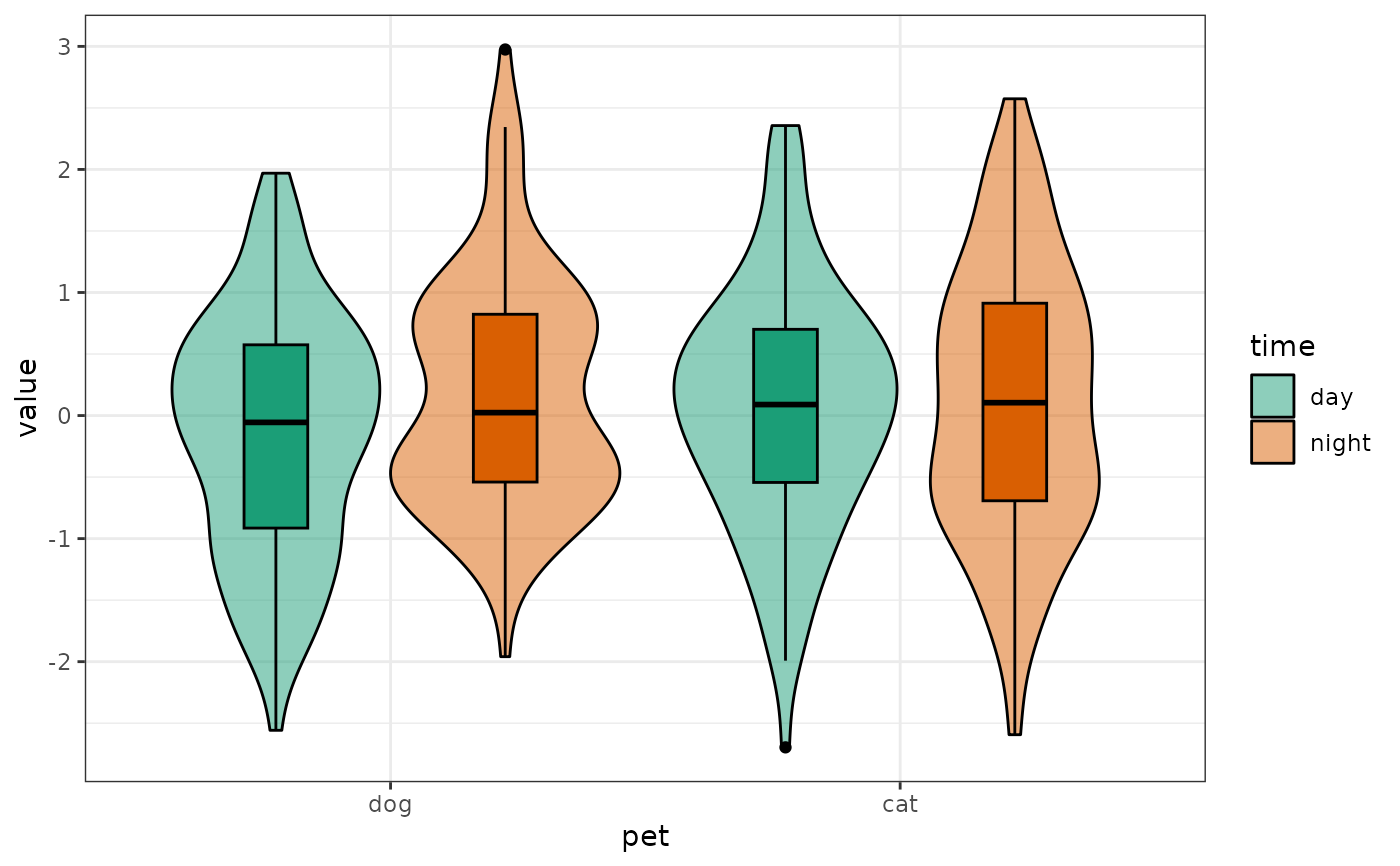
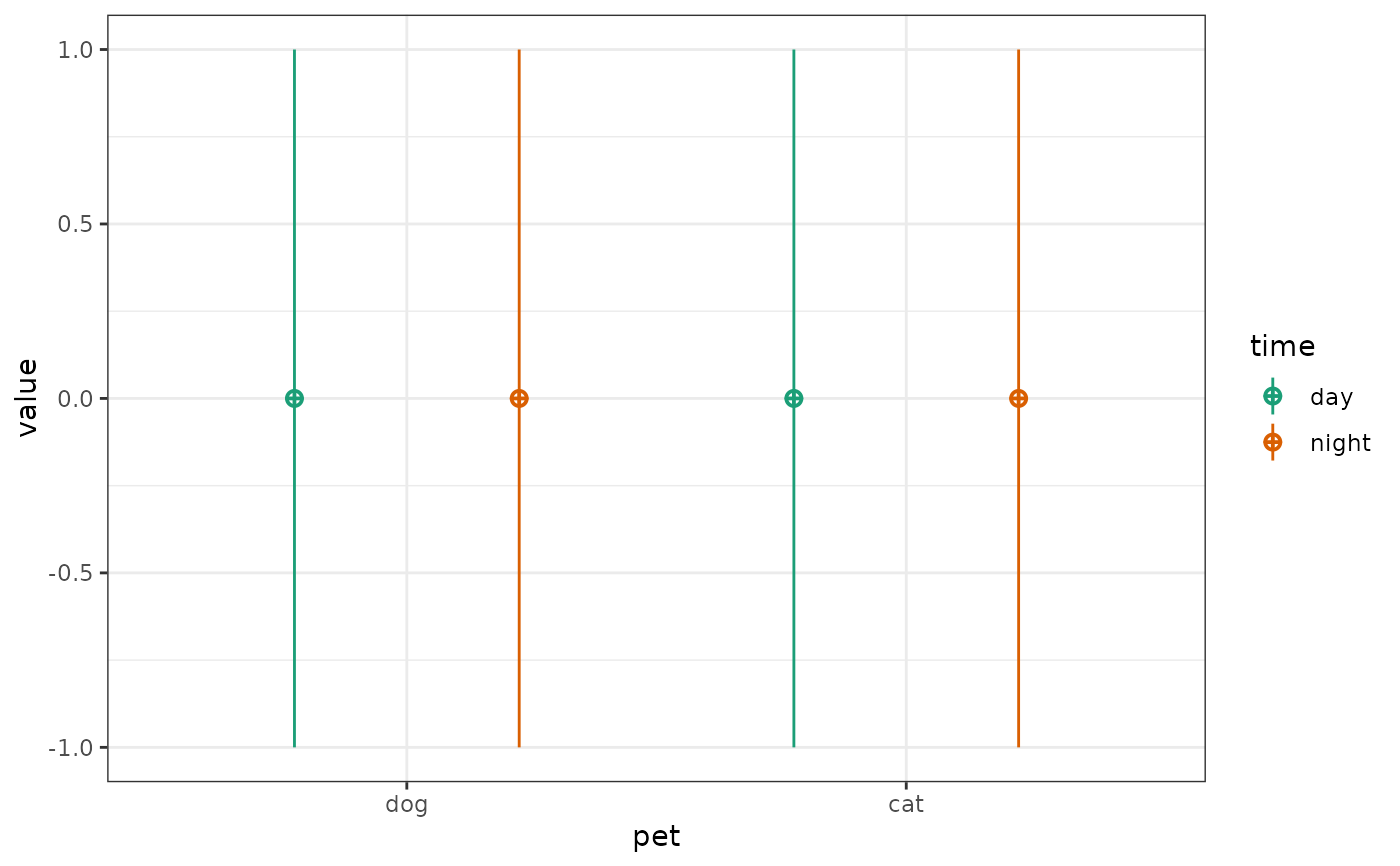
A list of ggplot2 geoms to display, defaults to "pointrangeSD" (mean ± 1SD) for designs and c("violin", "box") for data, options are: pointrangeSD, pointrangeSE, violin, box, jitter
- palette
A brewer palette, defaults to "Dark2" (see ggplot2::scale_colour_brewer)
- labeller
How to label the facets (see ggplot2::facet_grid). "label_value" is used by default.
Functions
plot(design): Plotting from a faux design listplot(faux): Plotting from a faux data table
Examples
within <- list(time = c("day", "night"))
between <- list(pet = c("dog", "cat"))
des <- check_design(within, between, plot = FALSE)
plot_design(des)


data <- sim_design(within, between, plot = FALSE)
plot_design(data)
data <- sim_design(within, between, plot = FALSE)
plot_design(data)