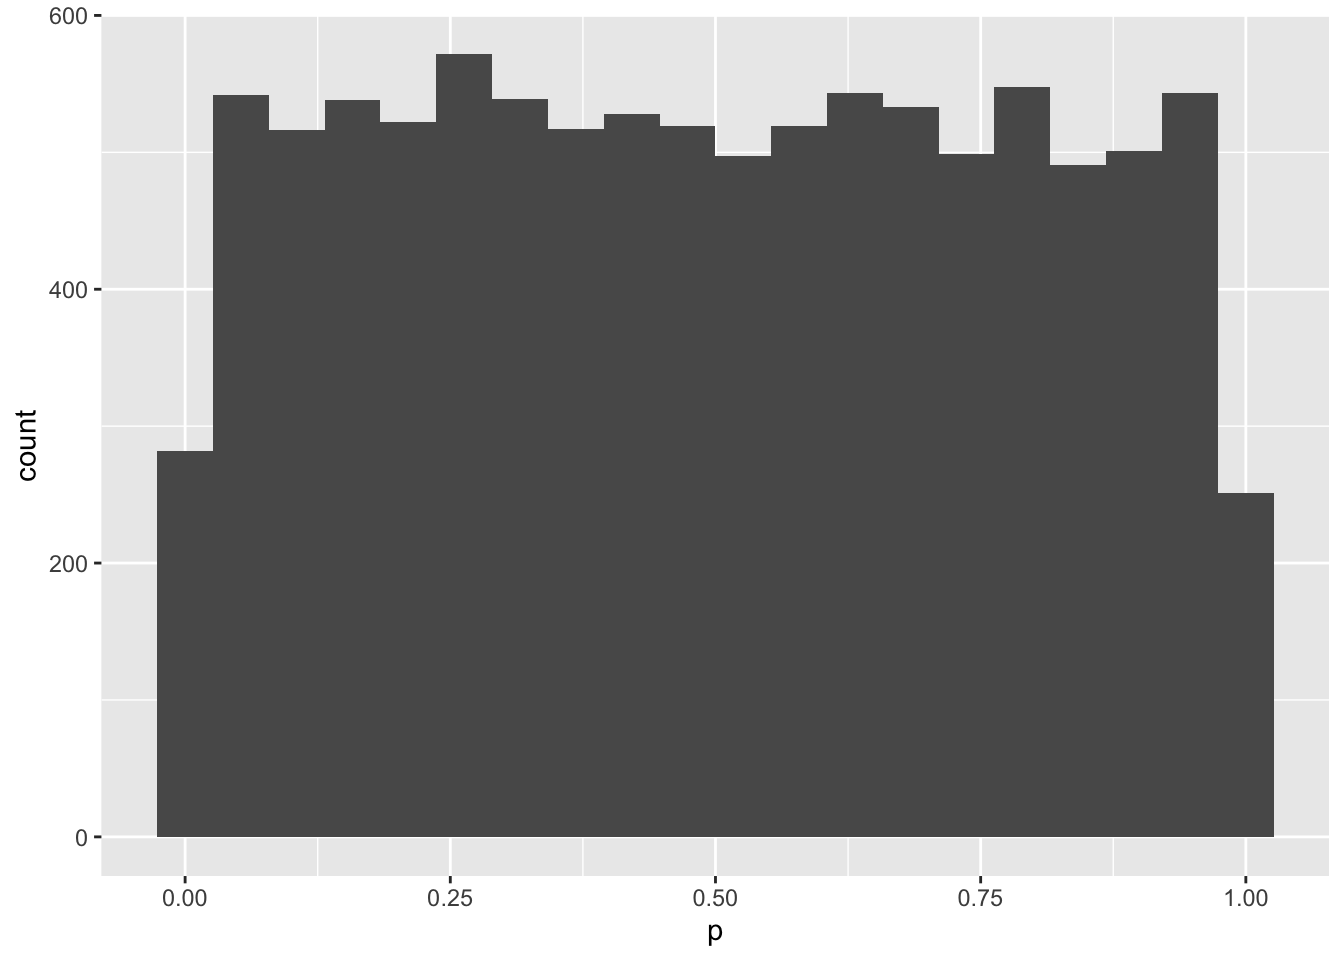
First, let’s make a data frame with two variables, a and b that are both sampled from a normal distribution with a mean of 0 and SD of 1. The variablle n will be how many samples we’ll take (100). Then we can run a t-test to see if they are different.
library(tidyverse)
── Attaching core tidyverse packages ──────────────────────── tidyverse 2.0.0 ──
✔ dplyr     1.1.4     ✔ readr     2.1.5
✔ forcats   1.0.0     ✔ stringr   1.5.2
✔ ggplot2   4.0.0     ✔ tibble    3.3.0
✔ lubridate 1.9.4     ✔ tidyr     1.3.1
✔ purrr     1.1.0
── Conflicts ────────────────────────────────────────── tidyverse_conflicts() ──
✖ dplyr::filter() masks stats::filter()
✖ dplyr::lag()    masks stats::lag()
ℹ Use the conflicted package (<http://conflicted.r-lib.org/>) to force all conflicts to become errors
n =100data <-data.frame(a =rnorm(n, 0, 1),b =rnorm(n, 0, 1))t <-t.test(data$a,data$b)t$p.value
[1] 0.1292152
Now let’s repeat that procedure 1000 times. The easiest way to do that is to make a function that returns the information you want.
tPower <-function() { n =100 data <-data.frame(a =rnorm(n, 0, 1),b =rnorm(n, 0, 1) ) t <-t.test(data$a,data$b)return(t$p.value)}tPower()
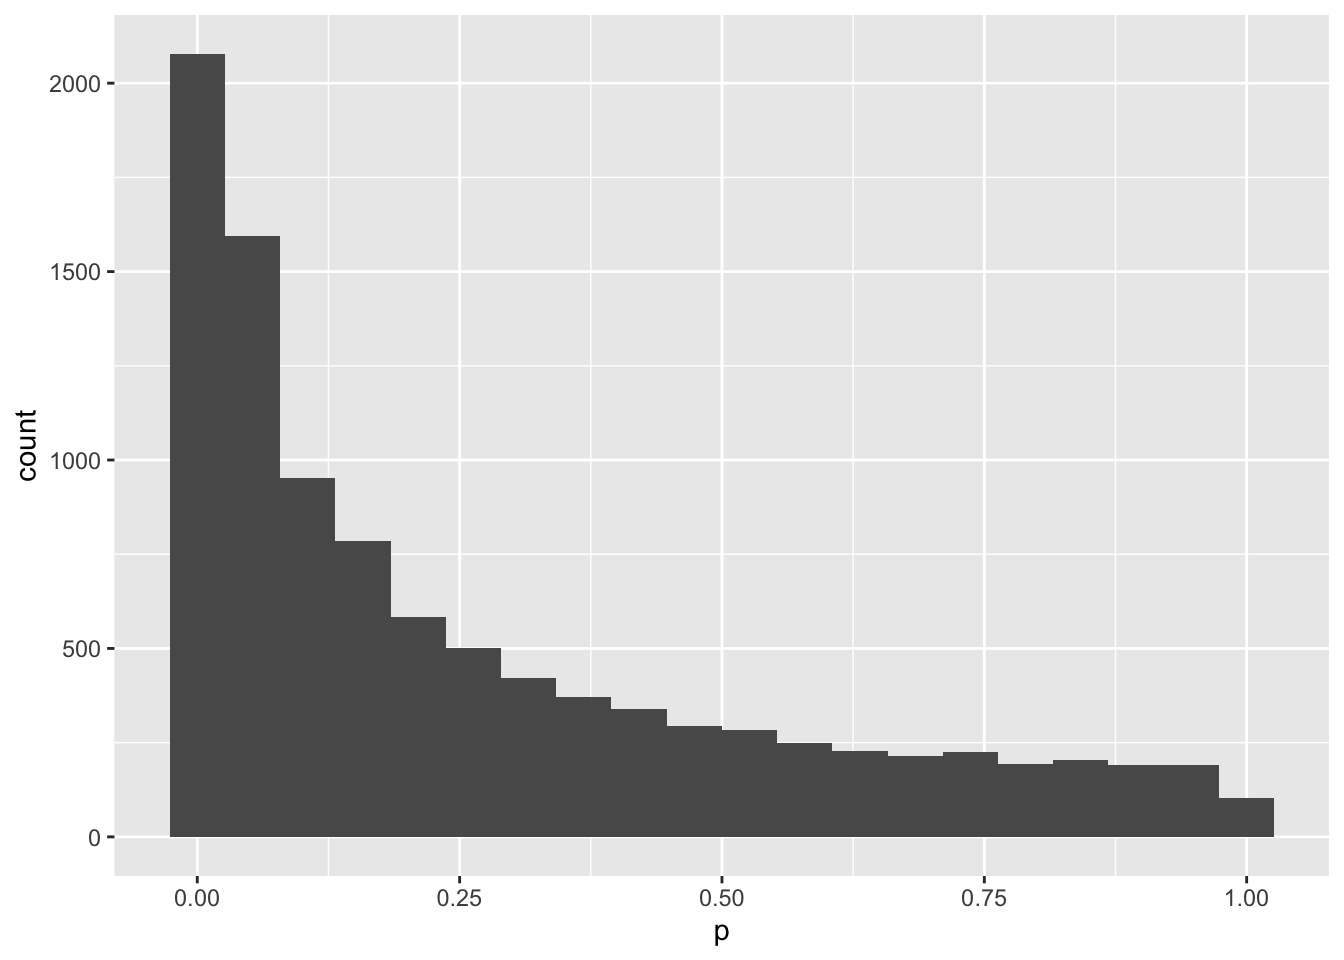
Hmm, you only get a p-value less than .05 30% of the time. That means that your study would only have 30% power to detect an effect this big with 100 subjects. Let’s make a new function to give you the p-value of a study with any number of subjects (you put the N inside the parentheses of the function).
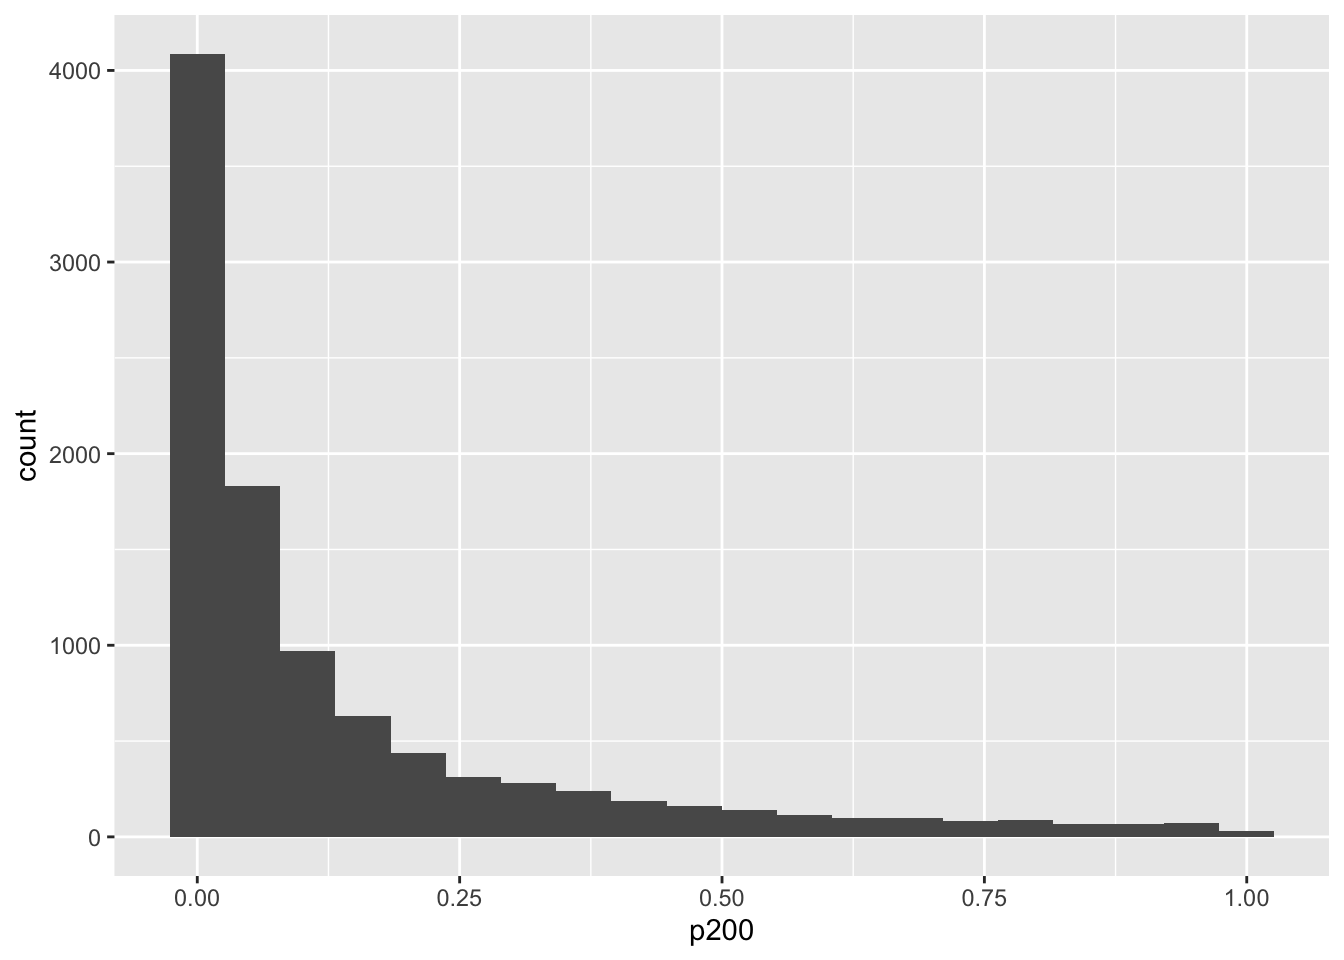
tPowerN <-function(n) { data <-data.frame(a =rnorm(n, 0, 1),b =rnorm(n, 0.2, 1) ) t <-t.test(data$a,data$b)return(t$p.value)}tPowerN(200)