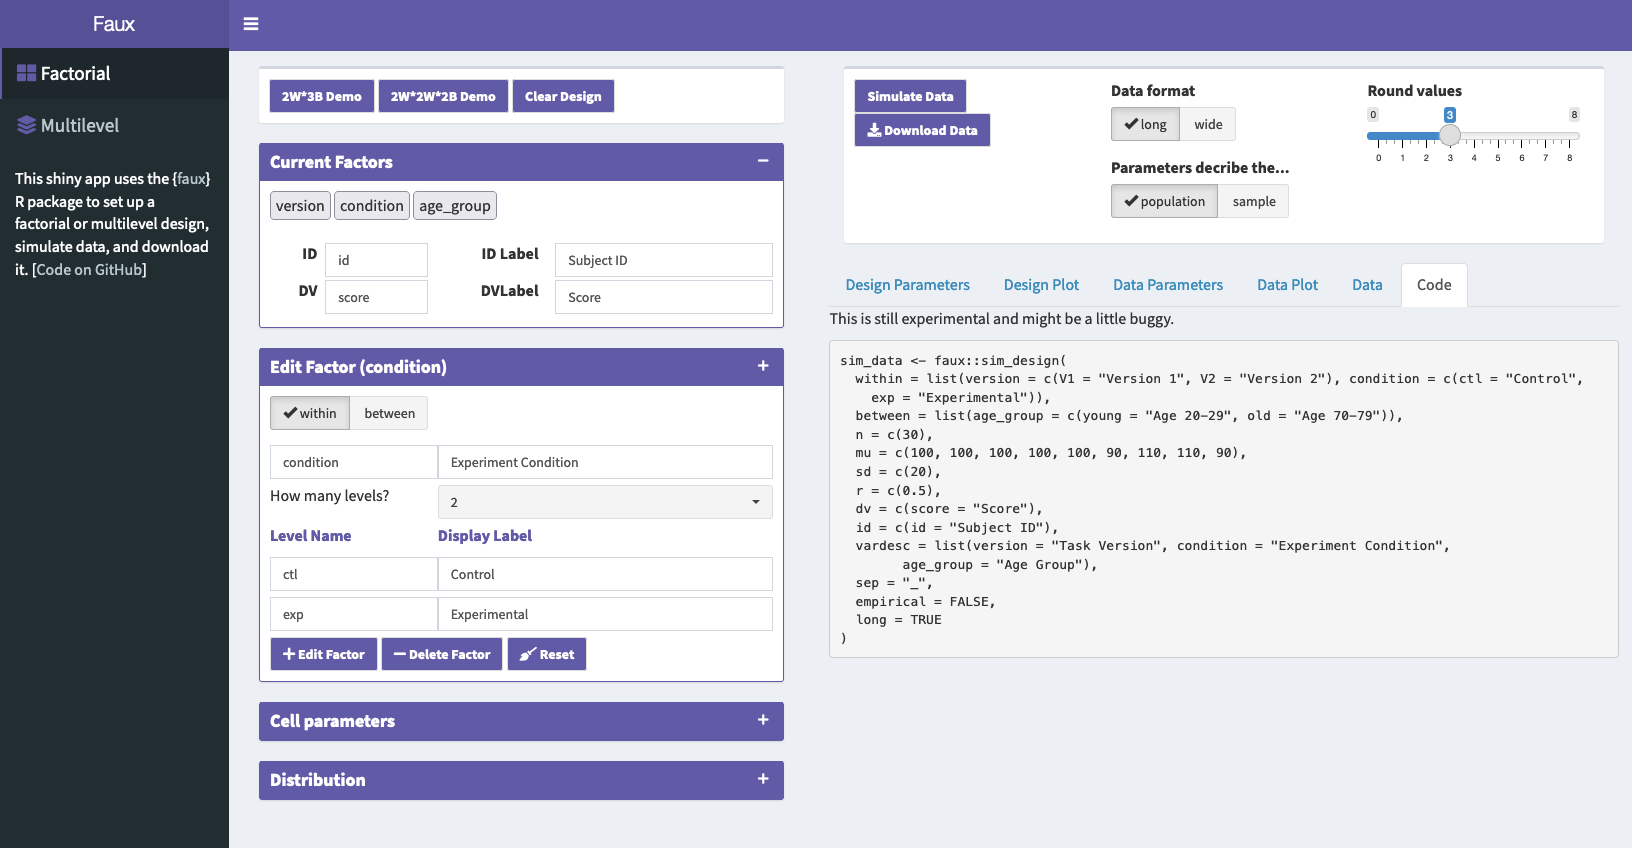
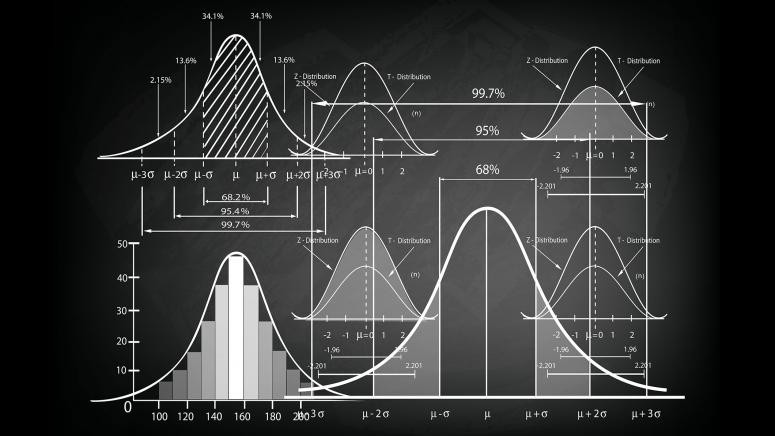
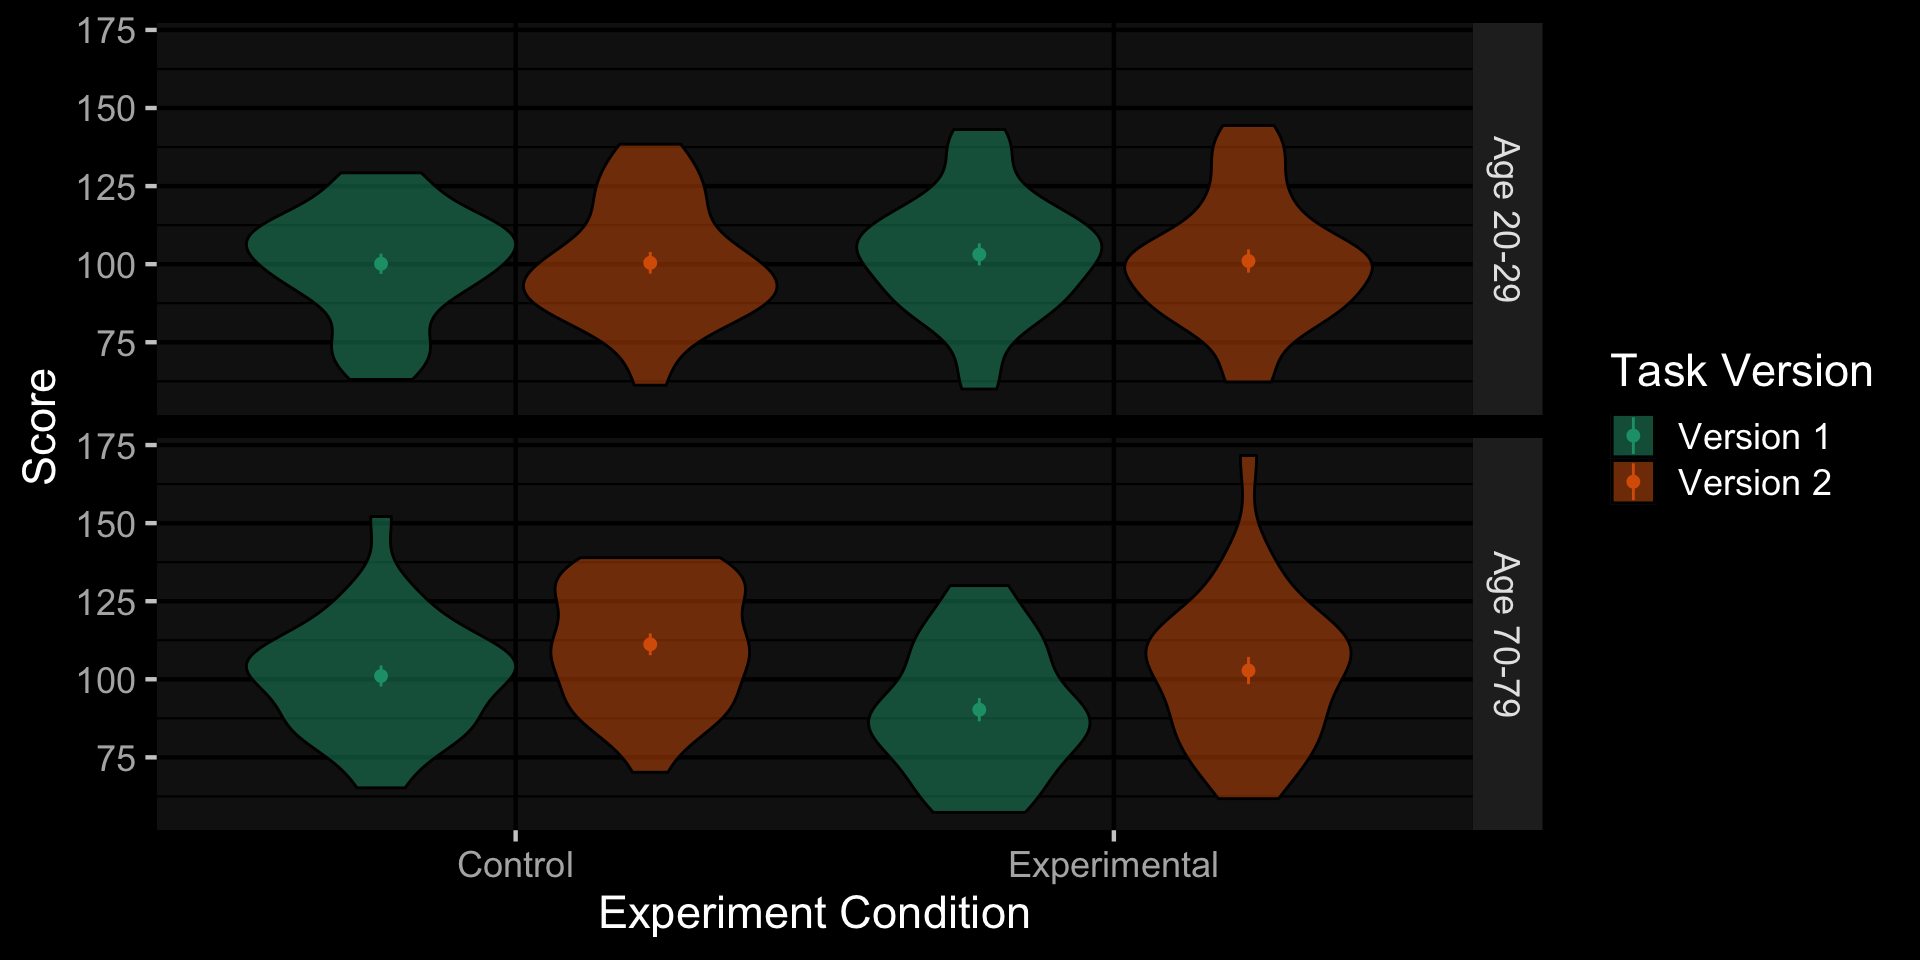
sim_data <- faux::sim_design(
  within = list(version = c(V1 = "Version 1", V2 = "Version 2"),
                condition = c(ctl = "Control", exp = "Experimental")),
  between = list(age_group = c(young = "Age 20-29", old = "Age 70-79")),
  n = 30,
  mu = c(100, 100, 100, 100, 100, 90, 110, 110),
  sd = 20,
  r = 0.5,
  dv = c(score = "Score"),
  id = c(id = "Subject ID"),
  vardesc = list(version = "Task Version",
                 condition = "Experiment Condition",
                 age_group = "Age Group"),
  long = TRUE
)Fake It Until You Make It
How and why to simulate research data
Pre-Registration

Prep analysis scripts for pre-registration
Power
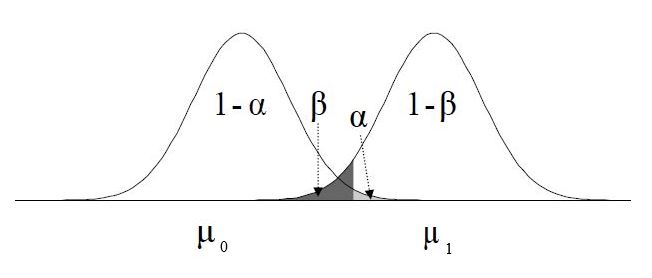
Calculate power and sensitivity for analyses that don’t have empirical methods
Reproducible Examples

Create reproducible examples when your data are too big or confidential to share
Enhance Understanding
Enhance your understanding of statistical concepts
Teaching Data

Create demo data for teaching and tutorials
Faux
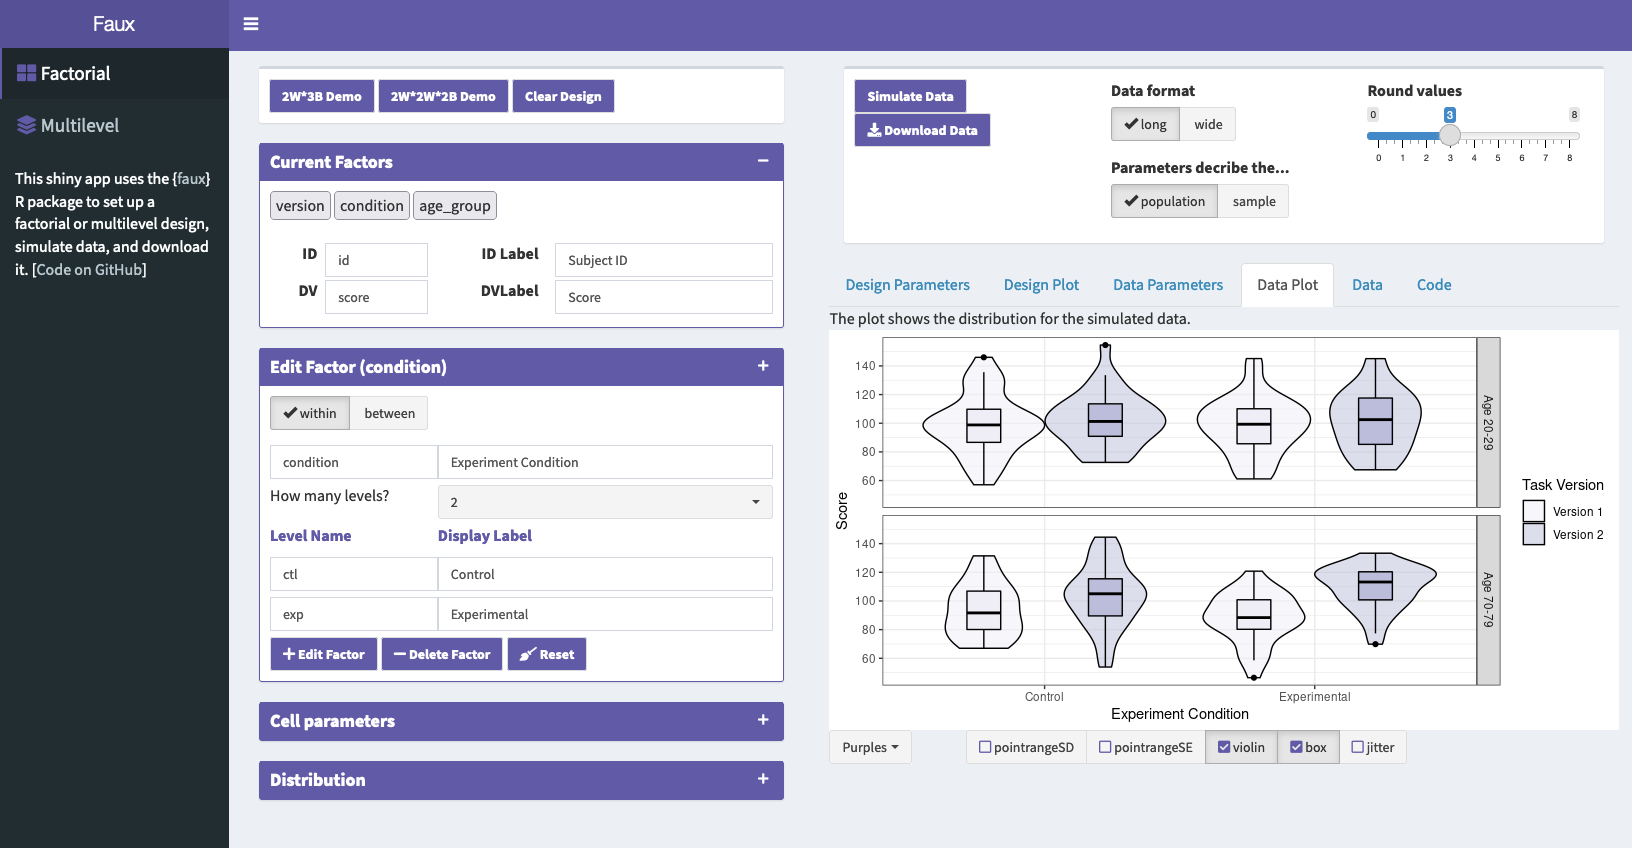
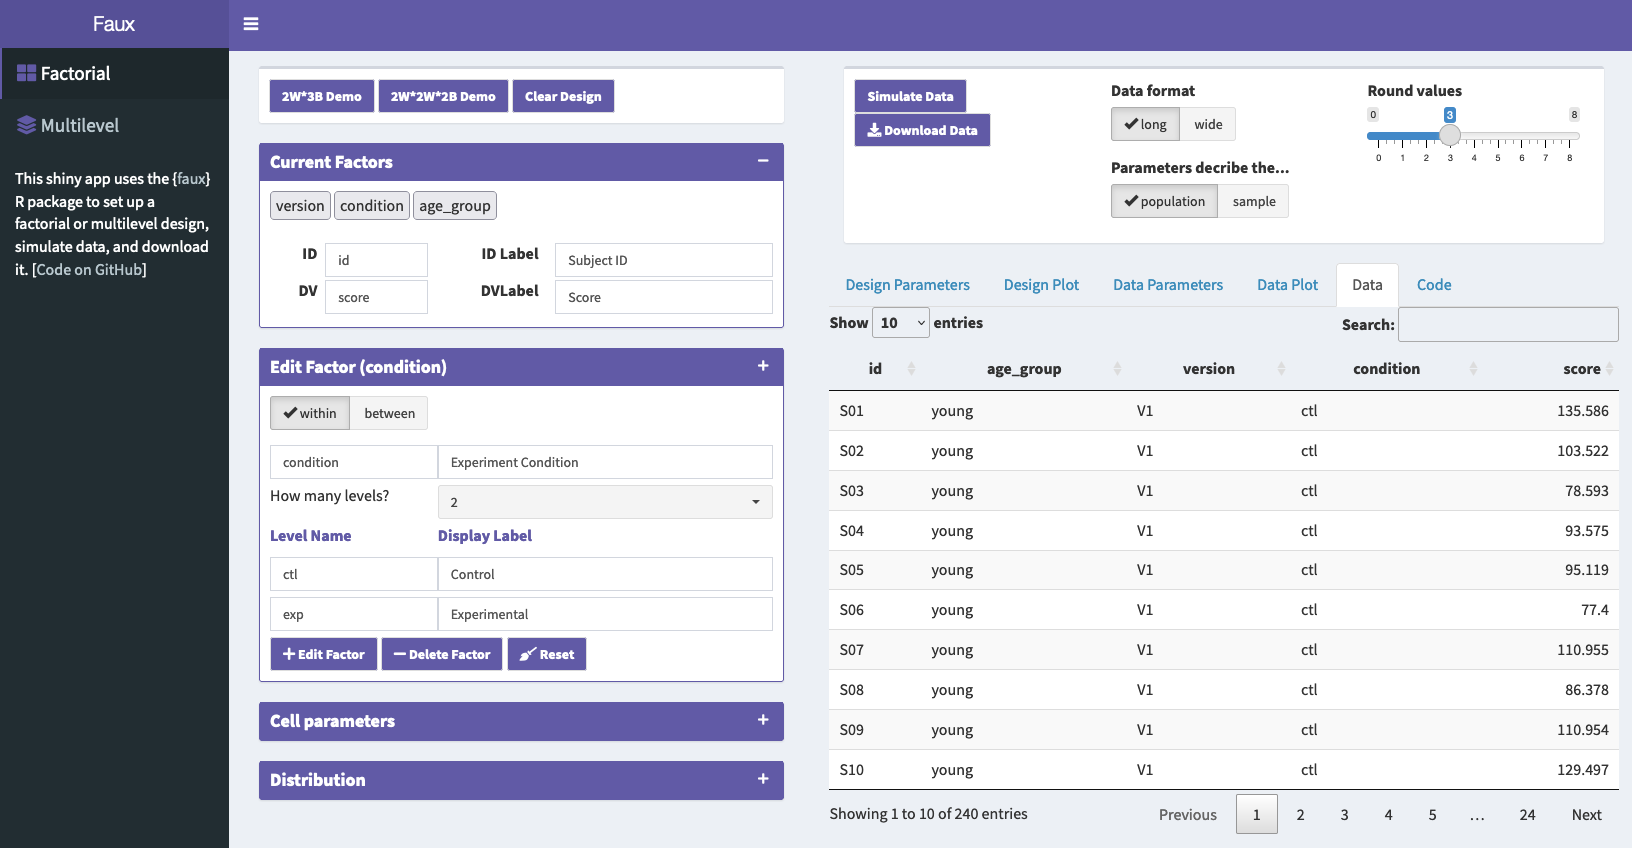
Faux Design Plot
Faux Data Plot
Further Resources


Thank You!
debruine.github.io/talks/EMPSEB-fake-it-2023/
Workshop Materials: tinyurl.com/data-sim
Prerequisites: Students will need to have very basic knowledge of R and familiarity with R Markdown, and have installed R and RStudio on their laptop and installed the packages {faux}, {afex}, {broom} and {tidyverse} from CRAN.