1 Fractions
1.1 Papercheck
Papercheck is an R package I’m working on with Daniel Lakens and colleagues. The purpose is to help researchers assess best practices in methodology and reporting. It can also be used to make meta-scientific work scriptable and easier.
1.1.1 PsychSci Open Badges
The package comes with a built-in dataset of 250 open-access papers from Psychological Science.
You can use the search_text() function to search any sentences that contain the word “badge”.
Check all the permutations of the badge statements.
It looks like the relevant statements all contain the word “received”.
Use grepl() to determine if these sentences contain the text “open data”, “open materials” and/or “preregistration”.
1.1.2 Paper Info
Now you can use the info_table() function to get information about each paper’s submission and acceptance dates. Then join this to the badge data and set NA values to FALSE.
The “submission” entry from grobid has a format like “Received 8/16/13; Revision accepted 12/22/13”, so it needs a little parsing (this is on my to-do list for automatically parsing when you load a grobid XML).
m <- gregexpr("\\d{1,2}/\\d{1,2}/\\d{2}", all_papers$received)
all_papers$year_received <- regmatches(all_papers$received, m) |>
  lapply(mdy) |>
  sapply(\(x) ifelse(length(x), year(x), NA))

m <- gregexpr("\\d{1,2}/\\d{1,2}/\\d{2}", all_papers$accepted)
all_papers$year_accepted<- regmatches(all_papers$accepted, m) |>
  lapply(mdy) |>
  sapply(\(x) ifelse(length(x), year(x), NA))
1.1.3 Calculate Fractions of Open Practices
Calculate the fraction of papers each year with open data, materials and preregistration.
1.2 Plot
Plot the data.
frac <- c(0, 1/10, 1/5, 1/4, 1/3, 2/5, 1/2, 3/5,  2/3, 3/4, 4/5, 9/10, 1)
label <- c("0", "1/10", "1/5", "1/4", "1/3", "2/5", "1/2", "3/5", "2/3", "3/4", "4/5", "9/10", "1")

ggplot(by_year, aes(x = year_received, y = frac, colour = name)) +
  geom_point(size = 3) +
  geom_line() +
  scale_x_continuous("Year Received", breaks = 2012:2024) +
  scale_y_continuous("Fraction of Papers", limits = c(0, 1),
                     breaks = frac, labels = label) +
  scale_colour_manual("Badge:", values = c("firebrick", "darkgreen", "dodgerblue3")) +
  labs(title = "Open Practice Badges",
       subtitle = "250 Open Access Psychological Science Papers",
       "debruine.github.io/30DCC-2025/01-fractions") +
  theme(legend.position = c(.2, .8),
        plot.caption = element_text(color = "dodgerblue"))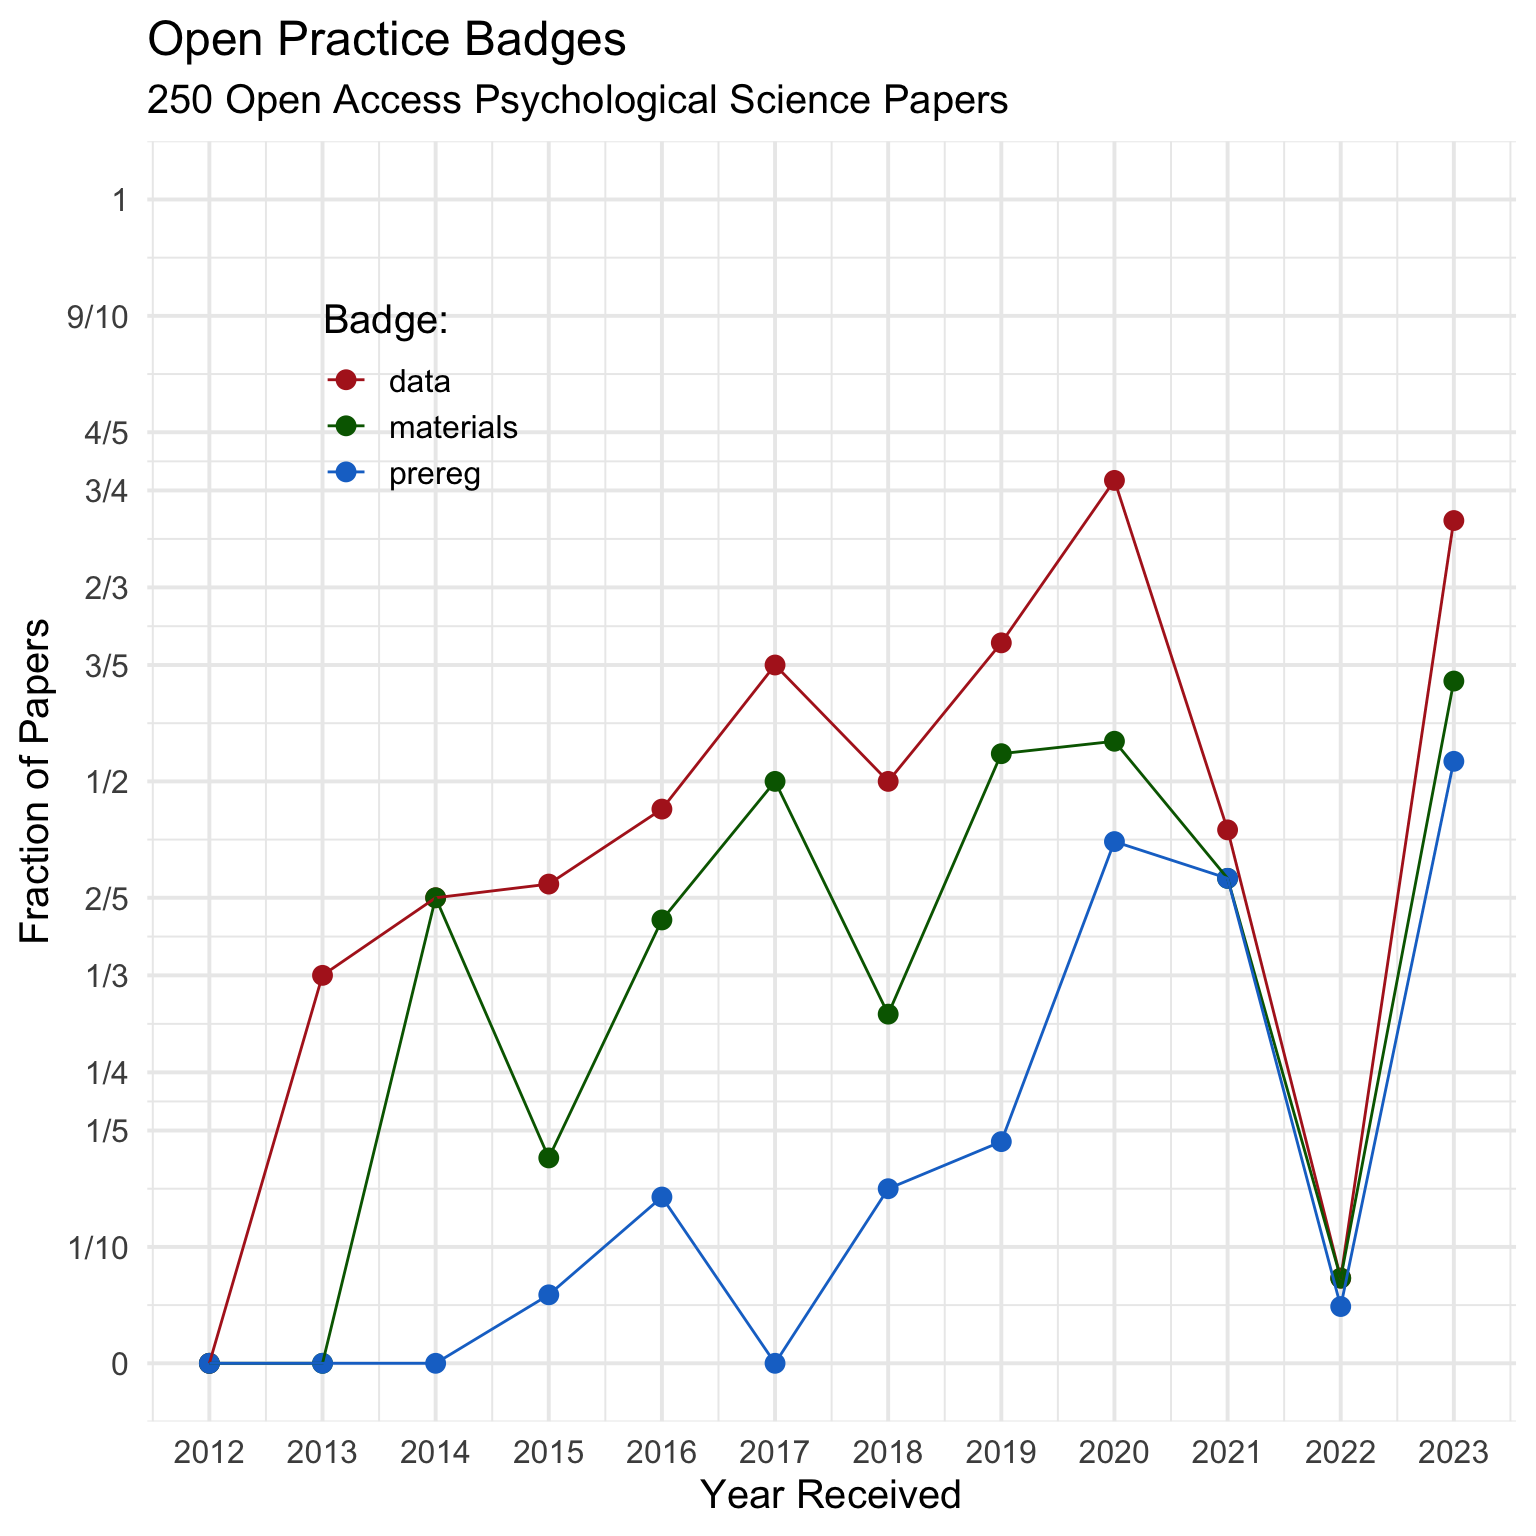
Something weird was going on in 2022. Let’s figure it out later.