4 Big or Small
I am old enough to remember calculating t or F values by hand, determining the degrees of freedom, and looking up the corresponding p-value in the appendix of my stats textbooks. By necessity, you could only approximate the p-value, leading to papers full of results like “p < .05” or “p < .01”.
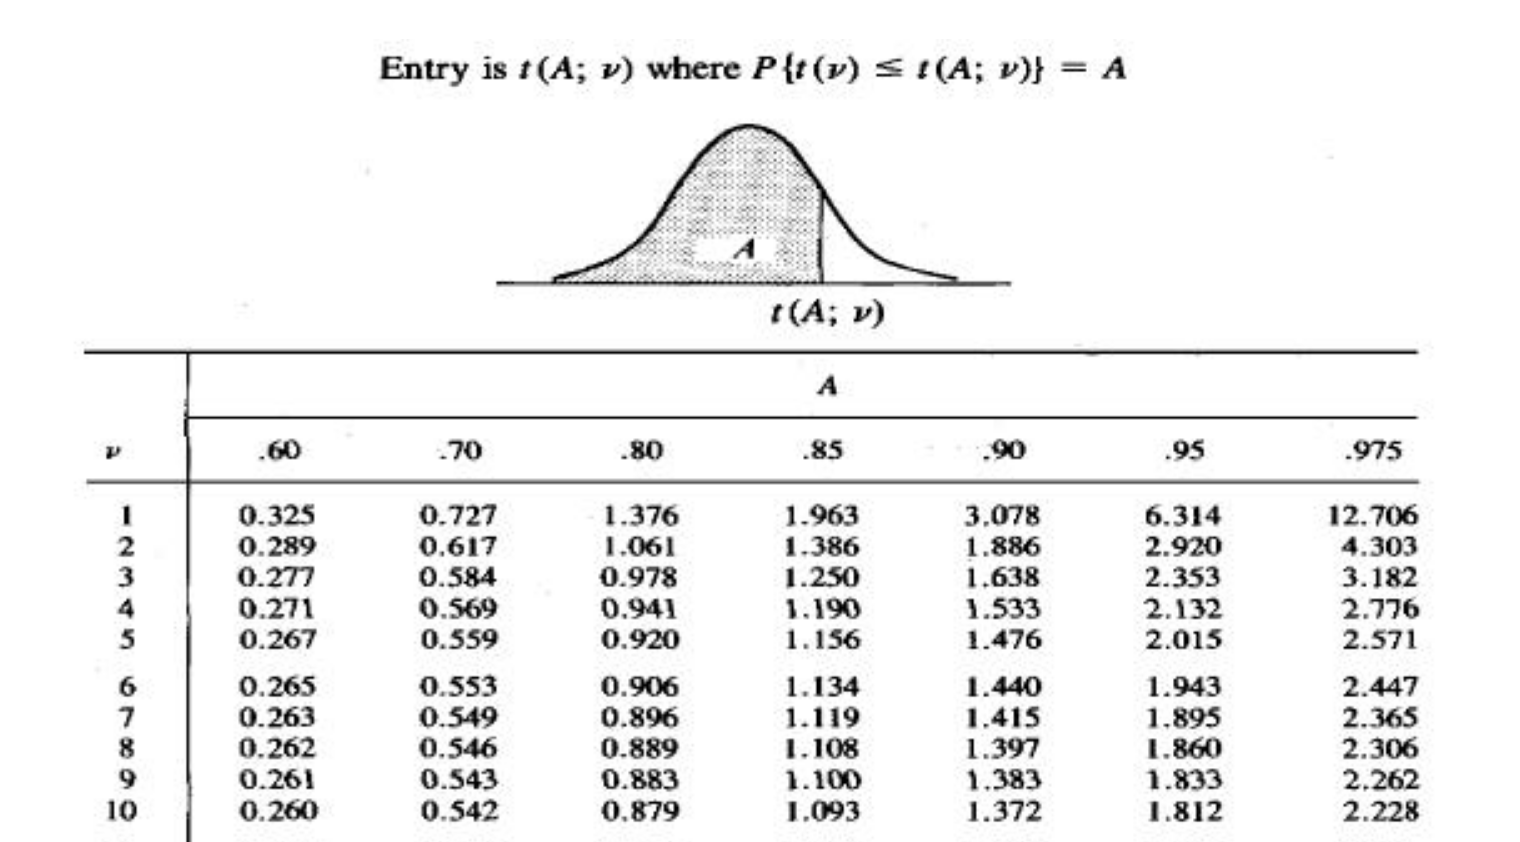
But we’ve had the ability to calculate the exact p-value for decades now, so there is no excuse to not include it. Let’s explore graphically how common the occurrence of inexact p-values is in the set of open access Psychological Science papers included in papercheck.
4.1 Modules
Papercheck is designed to be modular, so the community can contribute checks. Use module_list() to see the built-in modules.
| name | title | description | type | path |
|---|---|---|---|---|
| all-p-values | List All P-Values | List all p-values in the text, returning the matched text (e.g., ‘p = 0.04’) and document location in a table. | text | /Library/Frameworks/R.framework/Versions/4.4-arm64/Resources/library/papercheck/modules/all-p-values.mod |
| all-urls | List All URLs | List all the URLs in the main text | text | /Library/Frameworks/R.framework/Versions/4.4-arm64/Resources/library/papercheck/modules/all-urls.mod |
| imprecise-p | Imprecise P-Values | List any p-values reported with insufficient precision (e.g., p < .05 or p = n.s.) | code | /Library/Frameworks/R.framework/Versions/4.4-arm64/Resources/library/papercheck/modules/imprecise-p.mod |
| llm-summarise | Summarise Sections | Generate a 1-sentence summary for each section | llm | /Library/Frameworks/R.framework/Versions/4.4-arm64/Resources/library/papercheck/modules/llm-summarise.mod |
| marginal | Marginal Significance | List all sentences that describe an effect as ‘marginally significant’. | text | /Library/Frameworks/R.framework/Versions/4.4-arm64/Resources/library/papercheck/modules/marginal.mod |
| osf-check | Check Status of OSF Links | List all OSF links and whether they are open, closed, or do not exist. | code | /Library/Frameworks/R.framework/Versions/4.4-arm64/Resources/library/papercheck/modules/osf-check.mod |
| ref-consistency | Reference Consistency | Check if all references are cited and all citations are referenced | code | /Library/Frameworks/R.framework/Versions/4.4-arm64/Resources/library/papercheck/modules/ref-consistency.mod |
| retractionwatch | RetractionWatch | Flag any cited papers in the RetractionWatch database | code | /Library/Frameworks/R.framework/Versions/4.4-arm64/Resources/library/papercheck/modules/retractionwatch.mod |
| sample-size-ml | Sample Size | [DEMO] Classify each sentence for whether it contains sample-size information, returning only sentences with probable sample-size info. | ml | /Library/Frameworks/R.framework/Versions/4.4-arm64/Resources/library/papercheck/modules/sample-size-ml.mod |
| statcheck | StatCheck | Check consistency of p-values and test statistics | code | /Library/Frameworks/R.framework/Versions/4.4-arm64/Resources/library/papercheck/modules/statcheck.mod |
4.1.1 Imprecise P-Values
The module “imprecise-p” lists instances of p-values that are not exact value or p < .001.
| text | p_comp | p_value | section | header | div | p | s | id |
|---|---|---|---|---|---|---|---|---|
| p < .05 | < | 0.050 | results | Tryptophan depletion and sensitivity to social norms | 7 | 1 | 3 | 0956797614527830 |
| p < .005 | < | 0.005 | fig | Fig. 2 . | 1 | NA | 5 | 0956797614527830 |
| p < .05 | < | 0.050 | fig | Finally, participants who | 4 | NA | 3 | 0956797614527830 |
| p < .05 | < | 0.050 | results | Results and discussion | 4 | 3 | 3 | 0956797614557697 |
| p < .05 | < | 0.050 | results | Results and discussion | 4 | 3 | 4 | 0956797614557697 |
| p > .29 | > | 0.290 | results | Results and discussion | 4 | 3 | 5 | 0956797614557697 |
Check what sections these are in.
| section | n |
|---|---|
| abstract | 3 |
| discussion | 13 |
| fig | 129 |
| funding | 1 |
| intro | 3 |
| method | 39 |
| results | 201 |
| tab | 23 |
Values in figure and table captions are probably something like “* p < .05, ** p < .01”, so let’s focus just on values in the results sections.
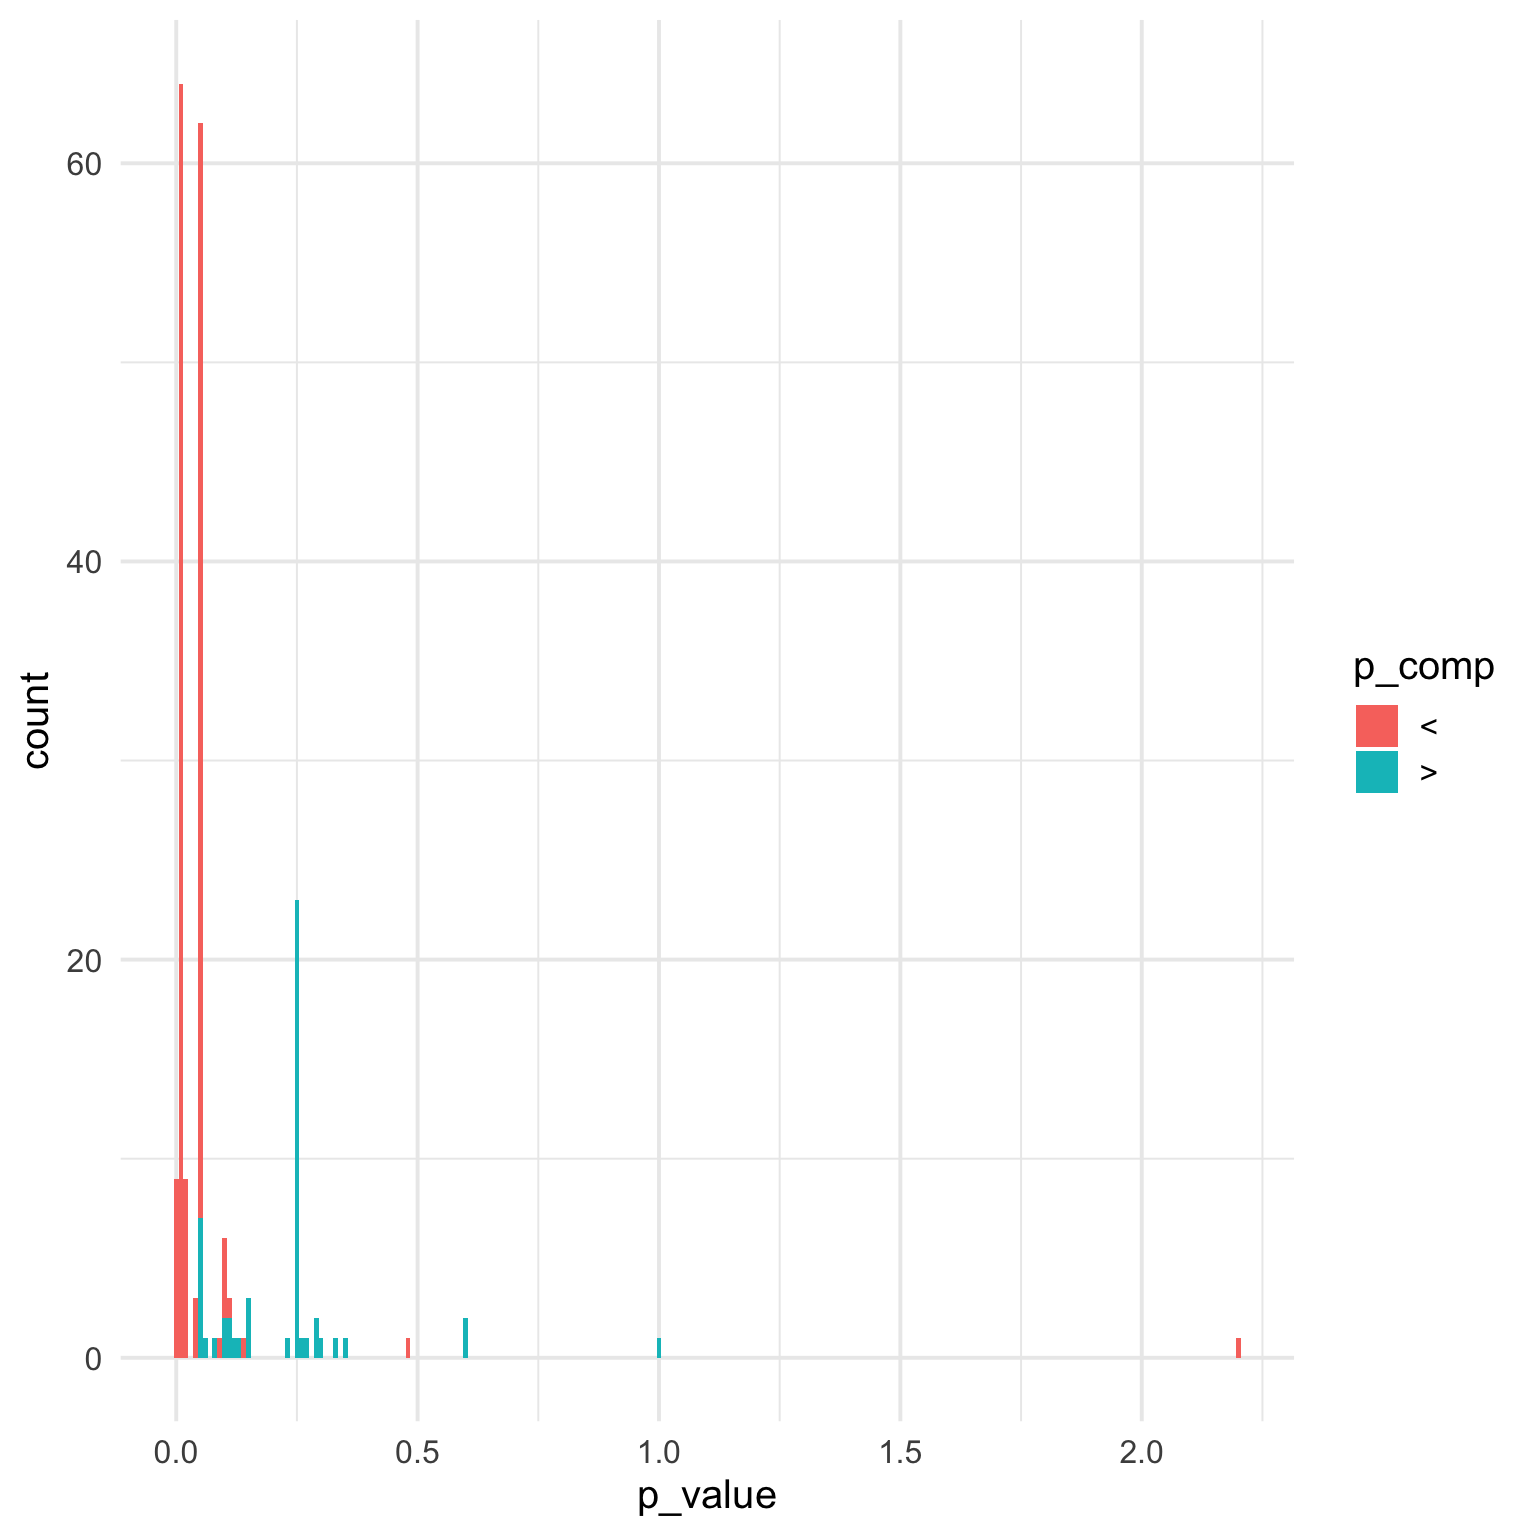
4.1.2 Fix x-axis
P-values in research are definitely not uniformly distributed, so let’s give this a log10 scale, change the binwidth to 0.1, and dodge the bars.
4.1.3 Impossible p-values?
OK, what is going on with the p-values over 1? You can use the expand_text() function to expand text to the full sentence of a selection, or add sentences before and/or after it.
| text | expanded |
|---|---|
| p < 2.2 | Adoptees had significantly fewer years of education (p = 3.3 × 10 -11 compared with group d; p < 2.2 × 10 -16 compared with all nonadopted individuals in the UK Biobank). |
| p < 2.2 | This clock was less accurate than the PedBE clock but still correlated with chronological age, r = .64, 95% CI = [.57, .70], t(308) = 14.77, p < 2.2 × 10 -16 . |
| p < 2.2 | Epigenetic age was calculated using the PedBE clock (L M McEwen et al., 2020; https:// github.com/kobor-lab/Public-Scripts/blob/master/ PedBE.Md), which was highly correlated with chronological age, r = .89, 95% confidence interval (CI) = [.85, .92], t(308) = 24.70, p < 2.2 × 10 -16 . |
It looks like these are somewhat non-standard ways of writing scientific notation (papercheck will correctly read, for example, 2.2e-16) that I’ll need to update the module to detect in a later revision. Let’s just exclude them for now.
4.1.4 P > 0.25
What’s going on with “p < .25”?
It’s not just one paper, is this a norm in some fields?
4.2 Tidy Up
4.2.1 Thresholds
Maybe some of these “p < .05” statements are about thresholds, not imprecise reporting. Let’s check the full sentence for the first instance of an imprecise p-value in each paper.
exp <- p |> expand_text(psychsci)

# get the first instance per paper
exp |>
  slice(1, .by = id) |>
  pull(expanded)
[1] "(Statistical significance was tested against a threshold of p < .05; bootstrapped models that provided 95% confidence intervals for the coefficients described below can be found in Table S2 in the Supplemental Material.)"
[2] "Crucially, we also found significant effects of congruence: Participants reported lower confidence overall when TMS was incongruent with their response than when it was congruent (p < .05)."
[3] "Better selfcontrol correlated with higher intelligence (r = .41, p < .01) and to a lesser extent with higher social class (r = .14, p < .01); these results are in line with previous research (Moffitt et al., 2011)."
[4] "Generalized linear models (repeated measures ANCOVA with Poisson errors) in which time was a covariate confirmed a significant interaction effect between experimental group and time, χ 2 (1, N = 52) = 8.05, p < .01, which illustrated a difference between the time dynamics of intrusive memories between the two experimental groups."
[5] "Direct pairwise comparisons via bootstrapped t-test analyses indicated that requests with photographs classified as happy were funded at a higher rate than those with photographs classified as sad (the category with the next best lending rate), t(3023) = 2.02, p < .05, β = 0.133, 95% CI = [0.004, 0.263])."
[6] "Time increased negative attitudes among liberal participants, b = 0.13, SE = 0.06, 95% CI = [0.02, 0.24], t(1922) = 2.34, p = .020, but did not affect attitudes among conservative participants, b = -0.04, SE = 0.06, 95% CI = [-0.15, 0.07], t(1922) = -0.64, p > .250."
[7] "Significant results are presented in boldface (p < .05)."
[8] "The results showed no difference in the weight assigned to the value of losses and gains per se, t(55) < 1.2, p > .23, Cohen's d < .17, only to the weight assigned to the associated feelings-expected feelings: t(55) = 3.59, p = .001, 95% CI = [1.29, 4.55], Cohen's d = .479; experienced feelings: Feeling (Change From Baseline) t(55) = 2.28, p = .027, 95% CI = [0.197, 2.89], Cohen's d = 0.307."
[9] "The twoway interactions between knowledge distance and search effort (odds ratio = 1.67, p = .080) and between knowledge distance and search variation (odds ratio = 0.65, p = .077) were marginally significant, whereas the interaction between search effort and variation was not significant (odds ratio = 1.01, p > .250)."
[10] "In addition, a main effect of participant sex emerged, F(1, 361) = 8.86, p < .01, η p 2 = .02, 90% CI = [.005, .056], with men diversifying less than women."
[11] "Paired-samples t tests for the pseudoword items showed no significant effect of the case format of the initial letter on accuracy, t(25) < 1, p > .250, or RTs, t(25) = 1.33, p = .195."
[12] "Consequently, receivers' use of the odd-oneout signal on inversion trials did not differ significantly from their use of the odd-one-out signal on one-ax trials (p > .250), in which alternate selection strategies (M = .02, SE = .02) were only negligibly deployed."
[13] "For inferential purposes, we selected a two-tailed cutoff value of p < .05."
[14] "We found no gender differences in task performance, t(51) = -0.21, p > .250."
[15] "Planned comparisons showed that participants who were trained in numerosity discrimination showed significantly improved performance in numerosity discrimination at Test Session 2, z = 3.38, p < .02, but those gains were not sustained at Test Session 3, z = 1.39, n.s."
[16] "Using the same fixed-effects model as before (Equation 1) to examine change in Web browsing behavior in the week after the earthquake, we found that although greater intensity predicted more visits to communications Web sites, t = 14.0, p < .001, and functional Web sites, t = 12.23, p < .001, it predicted fewer visits to hedonic Web sites, t = -3.00, p < .01 (see Section 4.2 in the Supplemental Material)."
[17] "Indeed, there was no statistically significant relationship between endorsements of anger and disgust, r = -.01, 95% confidence interval (CI) = [-.15, .13], p > .25."
[18] "These effects were not significantly correlated across individuals (Fig. 2b), which suggests that there was no relationship between the two kinds of motivation (Pearson's r = .10, p > .25)."
[19] "In both-targets blocks, saccade latencies were smaller than in one-target blocks, but did not differ significantly for switch trials (M = 234 ms) and repeat trials (M = 232 ms), t(11) = 0.25, p > .250, Cohen's d = 0.09."
[20] "It was not, however, associated with the more general aggregated measures of experienced reward (p > .250), nor perceived expresser reward (p > .250)."
[21] "Note: Correlations significant at the p < .05 level are highlighted in bold."
[22] "Notably, though, Time 7 reading fluency did predict Time 7 reading comprehension when family risk was omitted from the model, β = 0.29, p < .01."
[23] "The increase in risk was modest: a standard-deviation decrease in the polygenic score was associated with a 20% to 30% greater risk of having been cautioned or convicted (E-Risk cohort: incidencerate ratio, or IRR = 1.33, 95% CI = [1.13, 1.55], p < .01; Dunedin cohort: IRR = 1.21, 95% CI = [1.09, 1.34], p < .01; Table 1)."
[24] "Participants were more likely to lie when their partner lied compared with when their partner reported honestly in the previous report (i.e., previous round for first movers and previous stage for second movers; Wilcoxon signed-rank test, p < .01)."
[25] "The time series of positive affect shows some signs of collective behavior (ϕ = 0.26, 95% CI = [0.042, 0.474], p < .05), but with a weaker memory than negative affect."
[26] "This effect was also visible in the right aPFC, although it did not reach statistical significance (threshold p < .005, uncorrected, MNI values for local maxima: x = 24, y = 60, z = 16)."
[27] "Black asterisks indicate significant differences between groups, and red asterisks indicate significant differences between group mean responses and chance (*p < .05, **p < .01, ***p < .001)."
[28] "Asterisks on the x-axis indicate a significant nonzero effect of the factor congruence (i.e., a difference in RTs between gratings appearing at the location of a template-matching and a template-mismatching object), and asterisks above brackets indicate that this effect of congruence significantly differed between conditions (p < .005)."
[29] "Notwithstanding the lack of overall effect, workload significantly interacted with transaction frame, F(1, 268) = 12.748, p < .01, η p 2 = .045."
[30] "However, in boys, the difference between F0s in the gender-neutral and stereotypically male occupations was not significant, p > .05 (also see Fig."
[31] "Model comparison indicated a significant improvement in fit to the data of the more complex model including condition, χ 2 (1) = 8.89, p < .01."
[32] "Distance from the nearest COVID-19 epicenter (defined as a county with at least 10 con firmed coronavirus cases when the study was run; log-transformed because of right skew) was not significant ly related to belief in either true or false headlines but was negatively correlated with sharing intentions for both true and false headlines-no significant interactions with veracity, p > .15; the interaction between distance and condition was marginal, F(1, 25522) = 3.07, p = .080."
[33] "Greenhouse-Geisser-corrected values are reported when Mauchley's test of sphericity was significant (p < .05)."
[34] "The main effect of illness recency did not meet our preregistered threshold (p < .025)-recently ill: M = 661 ms, SD = 197; not recently ill: M = 626 ms, SD = 153, F(1, 400) = 4.23, η p 2 = .010, 90% CI = [.000, .039], p = .040-nor did the interaction between illness recency and face type (disfigured vs. typical), F(1, 400) = 1.87, η p 2 = .005, 90% CI = [.000, .027], p = .173."
[35] "Symbols indicate significant and marginally significant differences between groups ( † p < .10, *p < .05, ***p < .001, Bonferroni corrected)."
[36] "This effect was significant in Study 2, t(28) = -2.10, p = .045, 95% CI for the mean difference = [-3.9, -0.04], d = 0.29 (other parameters in Study 2: p > .352), indicating a modest general test-repetition effect across samples."
[37] "To assess the foreground bias, we compared responses to foreground and background conditions and found a significantly greater proportion of responses for the foreground than the background conditions for both the 250-ms duration, t(35) = 3.50, p < .002, d = 1.24, and the 330-ms duration, t(35) = 4.66, p < .001, d = 0.93."
[38] "Post hoc permutation analyses confirmed that the interaction stemmed from a difference between 3D and 2D stimuli for intact items; detection times for intact 3D items were shorter than for their 2D photographs (3D -2D: ΔM = -0.91 s, SD = 2.15, 95% CI = [-1.42, -0.41], uncorrected p < .005, FDR q < 0.01, d = 0.42)."
[39] "Statistical significance was determined using a Bayesian z test. *p < .05."
[40] "No participants scored below chance in the filler trials (< 31 based on a binomial probability distribution, p < .05), indicating that all participants were attending to the task and could therefore be included in the subsequent analyses."
[41] "A control model, in which self-ratings on the five personality traits were randomly shuffled within each participant, performed poorly (AIC = 196.4, χ 2 < .001, p > .999), and the parameter estimate of the randomly shuffled variable assessing participants' self-reported personality traits was nonsignificant, β ≤ -0.001, t(358.9) = -0.06, p = .95."
[42] "The extent of decrease was moderated by age: Older individuals exhibited shallower decreases in neuroticism (g 11 = 0.024, p < .01) and steeper decreases in openness (g 11 = -0.026, p < .001)."
[43] "First, we found that both the observed and simulated bias magnitudes increased as the physical probe distance increased (observed: r = .66, p < .002 for color; r = .55, p = .018 for shape; simulated: r = .94, p < .001 for color; r = .94, p < .001 for shape)."
[44] "When the classifier was trained on either the senders' or the receivers' facial muscle activity, it could predict the cued message significantly better than chance (chance hit rate = 16.7%; sender: M = 24.8%, SD = 5.9% across the tenfold cross-validation procedure; p < .001, n = 914 trials with data available from both muscles; Fig. 2c; receiver: M = 21.0%, SD = 4.4%; p < .05, n = 931 trials; Fig. 2d)."
[45] "Asterisks indicate significant differences between target locations (*p < .05, Bonferroni corrected), as determined by paired-samples t tests."
[46] "By contrast, cancer-related stress and depressive symptoms showed no significant associations among individuals who scored high on the index of psychosocial resilience (p > .05)."
[47] "An initial comparison of performance in the temporaldiscounting task examining delay duration (0 s, 15 s, 30 s) indicated a linear effect of delay: As expected, lemurs chose the larger reward less often as the delay increased, c 2 (2) = 11.97, p = .002 (p < .05 for significant comparison; for model parameters, see Table S3 in the Supplemental Material)."
[48] "There was no statistically signifi cant heterogeneity in the effects of scientificconsensus communication on belief in facts between experiments, τ 2 = 0.001, Q(39) = 48.72, p < .137, I 2 = 19.9%, 95% CI = [0%, 46.2%]."
[49] "The interaction between CS type and percept modality was significant, F(1, 26) = 17.91, p < .037, η 2 = .01."
[50] "We did not correct for multiple comparisons because the relation between response proportions at similar window sizes meant that these tests were not independent of one another; all comparisons therefore used a significance criterion of p < .05 based on the assumption that rates would be lower for the local boundary cases."
[51] "Path weights are standardized (*p < .05)."
[52] "As shown in Figure 3a, participants generally learned more from positive than from negative outcomes across all conditions, t(71) = 3.10, p < .01, d = 0.37, 95% CI = [0.00, 0.01]."
[53] "Regions with significant associations between loneliness and ISC are outlined in black; a false-discovery-rate corrected (FDR-corrected) significance threshold of p < .05 was used."
[54] "An exploratory factor analysis based on the raw behavior judgments with subsequent oblique rotation clearly indicated two factors (see Table S2), which were weakly correlated (r = .22, p < .01)."
[55] "As expected, there was a main effect of time interval, F( 4 the intervals differed between themselves (p < .01 for all comparisons), demonstrating that participants were accurate at discriminating between different intervals, which is consistent with findings of previous studies (Candini et al., 2022;Frassinetti et al., 2009;Magnani et al., 2013)."
[56] "The type of deprivation had specific effects on motivation, as participants reported neither more loneliness and desire for social contact in the food deprivation condition nor more hunger and desire for food in the social isolation condition (p > .25) compared with baseline."
[57] "We found a strong effect of base-rate manipulation on the perceived health-taste relationship within contexts, F(1, 61) = 6.93, p = .01, η p 2 = .10, as well as across contexts, F(1, 61) = 10.3, p < .01, η p 2 = .14."
[58] "In additional exploratory analyses, we found that a significant proportion of adults and children performed above chance levels by responding correctly on 100% of trials (binomial test, p < .01)."
[59] "It should be noted, however, that although these effects reached significance at the p < .05 level, the 95% CIs suggested they were not statistically significant."
[60] "Indeed, pupil dilation was significantly stronger prior to a saccade compared with a covert attentional shift from approximately 100 ms before target onset (Mdn β = 24.561, range = 13.599-29.752; Mdn t = 3.811, range = 2.582-4.138, p < .01; Fig. 2a)."
[61] "We found that having a greater proportion of peers who hold the gendermath stereotypical belief lowered girls' participation only in extracurricular mathematics courses (b = -0.016, SE = 0.010, p < .1)."
[62] "Pearson and Filon's z test (Pearson & Filon, 1898) revealed that empathic accuracy was more strongly correlated with both self-rated relationship satisfaction (z = 4.96, p < .001) and with peer-rated relationship satisfaction (z = 2.80, p < .01) than with cognitive ability."
[63] "In the first part of the main experiment, performance did not differ between the learned and not-learned character sets: the d′ scores were 1.3 for both sets, t(44) = 0.52, p > .60, d = 0.08, indicative of essential (prelearning) comparability of the two randomly selected sets of Chinese characters."
[64] "Model 4 reveals that after accounting for gender and birth year, there was a significant negative interaction between Republican partisanship and the Republican Culture Index (hazard ratio = 0.90, 95% CI = [0.82, 0.98], p < .05)."
[65] "Model fit was good, χ 2 (43) = 42.875, p < .477, CFI = 1.00, RMSEA < .001, SRMR = .03."
[66] "We found a statistically significant difference between the full and null models, β = 2.94, SE = 1.3, χ 2 (1) = 7.01, p < .01, indicating an above-chance preference for homomorphic orders."
[67] "For the opponent, significant increases in the likelihood of pitches being called strikes after the ejection are present for coaches' ejections (OR = 1.398, 95% CI = [1.211, 1.613], p < .001) but not for players' ejections (OR = 1.128, 95% CI = [0.982, 1.295], p < .1138)."
[68] "We then assessed whether there were differences in participant age across the profiles and found a very small effect, ANOVA: F(5, 644) = 2.291, p < .043, η 2 = .001."
[69] "The prediction from adolescent-reported household chaos at age 16 was significantly greater (p < .050) than that from parent reports for the six mental-health outcomes, including depression, self-control, aggression, anxiety, alcohol use, and antisocial behavior, with adolescents who reported experiencing greater household chaos suffering worse mental health in young adulthood."
[70] "compared to low-PE stimuli (mean confidence = 2.6 ± 0.12), with 23 of 25 participants showing a significant (p < .05) elevation in confidence (Fig. 3b; bootstrap test), leading to a large effect at the group level, t(24) = -5.77, p < .001, d z = -1.63."
[71] "In separate logistic regressions for each position in each sample, the framing effect remained significant at the p < .05 level in seven of the eight tests."
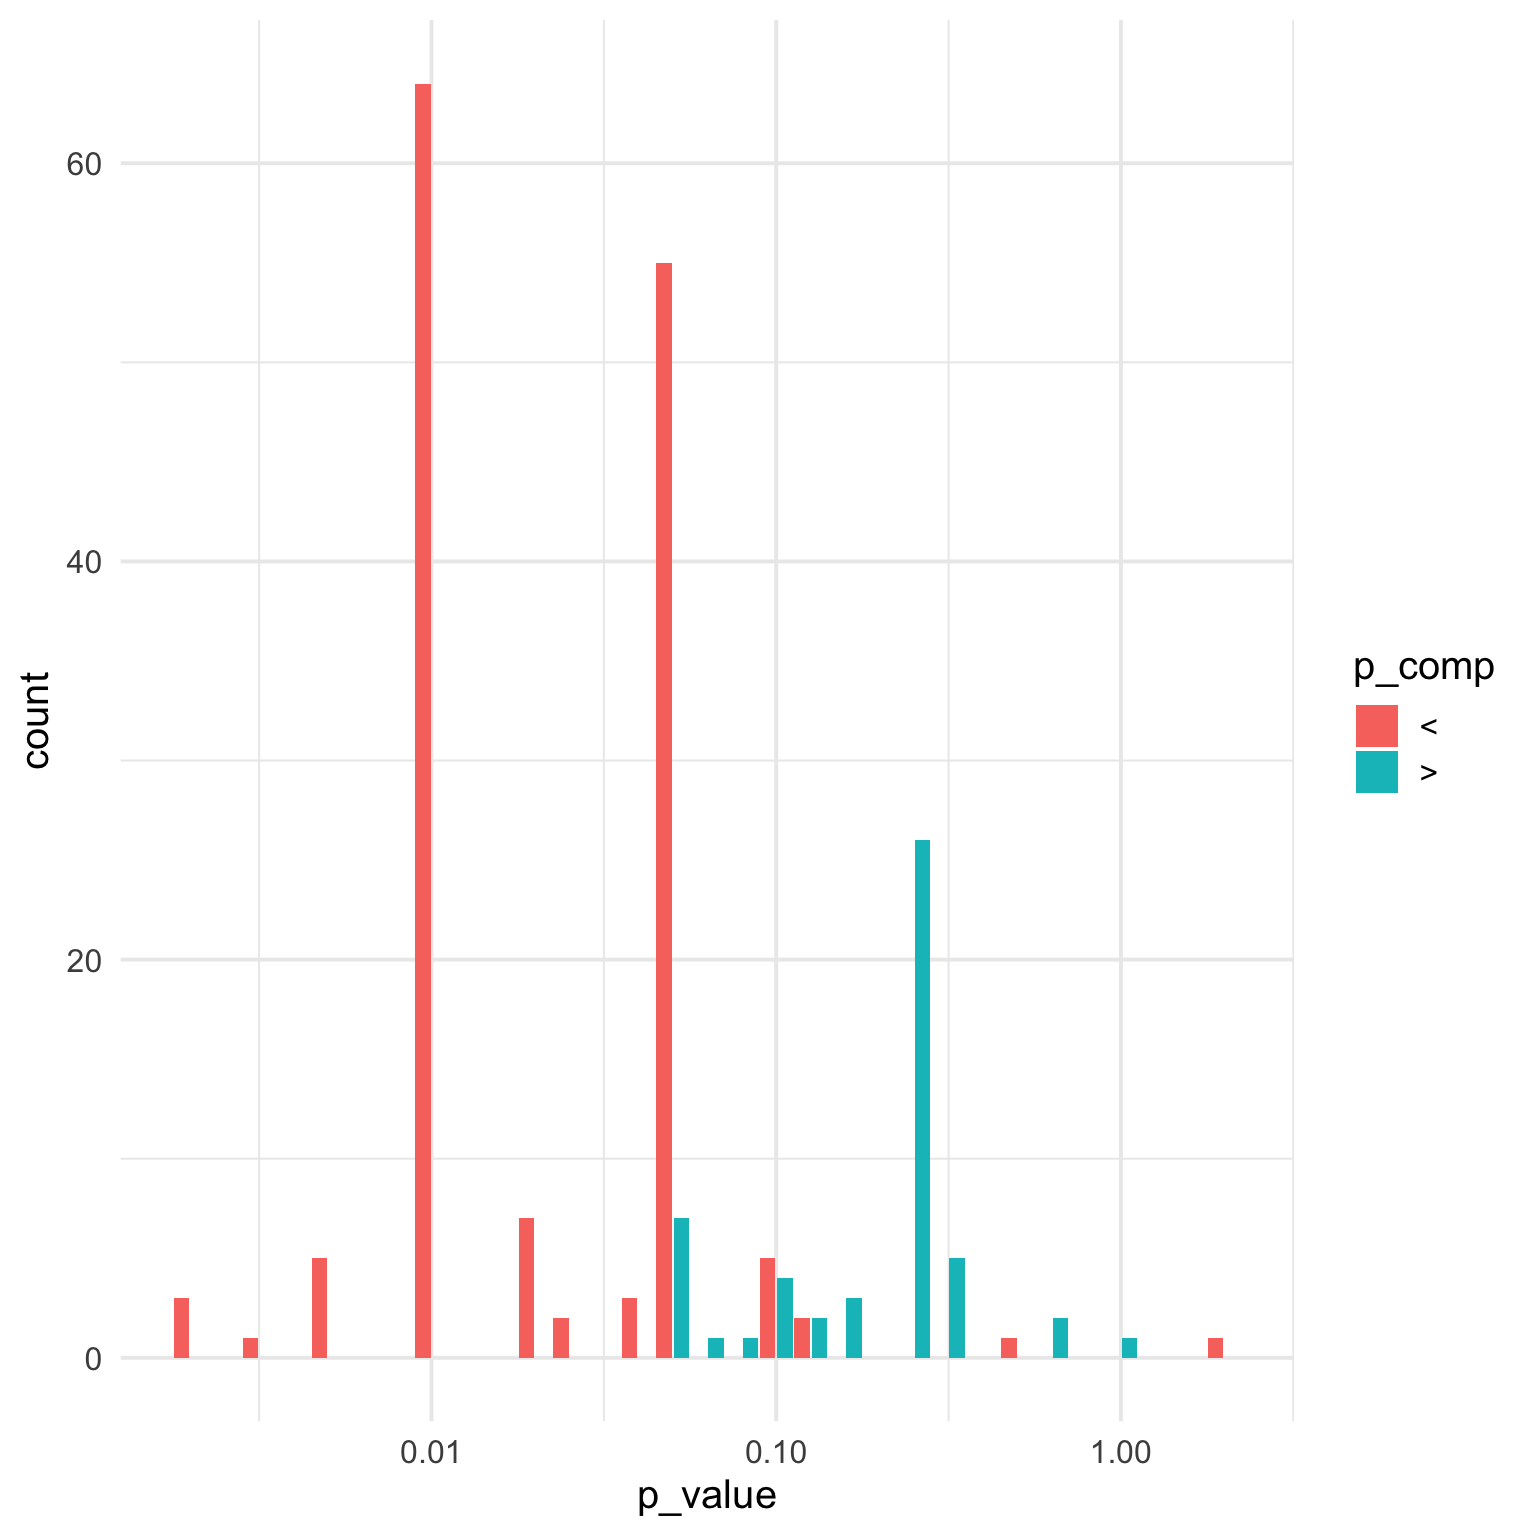
[72] "A rank-based Spearman's correlation test (p < .05 in the Shapiro-Wilk test of normality) indicates that in our sample there was no significant correlation between the calculated subjective-awareness score and the difference in RTs between high-and low-probability locations in the b-CFS task (r = .15, p = .488; see Fig. 2c), suggesting that the effect on conscious access did not depend on the level of awareness of the regularity." It looks like values with the words “threshold” or “cutoff” or an asterisk (“*“) tend to be statements about thresholds. Let’s check that and then exclude them.
 [1] "(Statistical significance was tested against a threshold of p < .05; bootstrapped models that provided 95% confidence intervals for the coefficients described below can be found in Table S2 in the Supplemental Material.)"
 [2] "Predictors were coded as follows-accuracy: error = 0, correct = 1; congruence: incongruent = 0, congruent = 1; time: preresponse = 0, postresponse = 1. **p < .01."
 [3] "The graph in (c) shows aggregate lending rate for photographs categorized as \"angry,\" \"calm,\" \"happy,\" and \"sad\"; asterisks with brackets indicate significant differences between categories, and the asterisk inside the data bar indicates a significant difference from the mean lending rate (*p < .05)."
 [4] "For inferential purposes, we selected a two-tailed cutoff value of p < .05."
 [5] "This effect was also visible in the right aPFC, although it did not reach statistical significance (threshold p < .005, uncorrected, MNI values for local maxima: x = 24, y = 60, z = 16)."
 [6] "Black asterisks indicate significant differences between groups, and red asterisks indicate significant differences between group mean responses and chance (*p < .05, **p < .01, ***p < .001)."
 [7] "The main effect of illness recency did not meet our preregistered threshold (p < .025)-recently ill: M = 661 ms, SD = 197; not recently ill: M = 626 ms, SD = 153, F(1, 400) = 4.23, η p 2 = .010, 90% CI = [.000, .039], p = .040-nor did the interaction between illness recency and face type (disfigured vs. typical), F(1, 400) = 1.87, η p 2 = .005, 90% CI = [.000, .027], p = .173."
 [8] "Symbols indicate significant and marginally significant differences between groups ( † p < .10, *p < .05, ***p < .001, Bonferroni corrected)."
 [9] "Symbols indicate significant and marginally significant differences between and within groups ( † p < .10, *p < .05, ***p < .001, Bonferroni corrected)."
[10] "Asterisks indicate significant components of the trends (dashed lines; *p < .05, ***p < .001)."
[11] "Statistical significance was determined using a Bayesian z test. *p < .05."
[12] "Asterisks indicate significant differences between target locations (*p < .05, Bonferroni corrected), as determined by paired-samples t tests."
[13] "Asterisks indicate significant differences between groups ( † p < .09, *p < .05, **p < .01)."
[14] "Path weights are standardized (*p < .05)."
[15] "Regions with significant associations between loneliness and ISC are outlined in black; a false-discovery-rate corrected (FDR-corrected) significance threshold of p < .05 was used." 4.2.2 Visuals
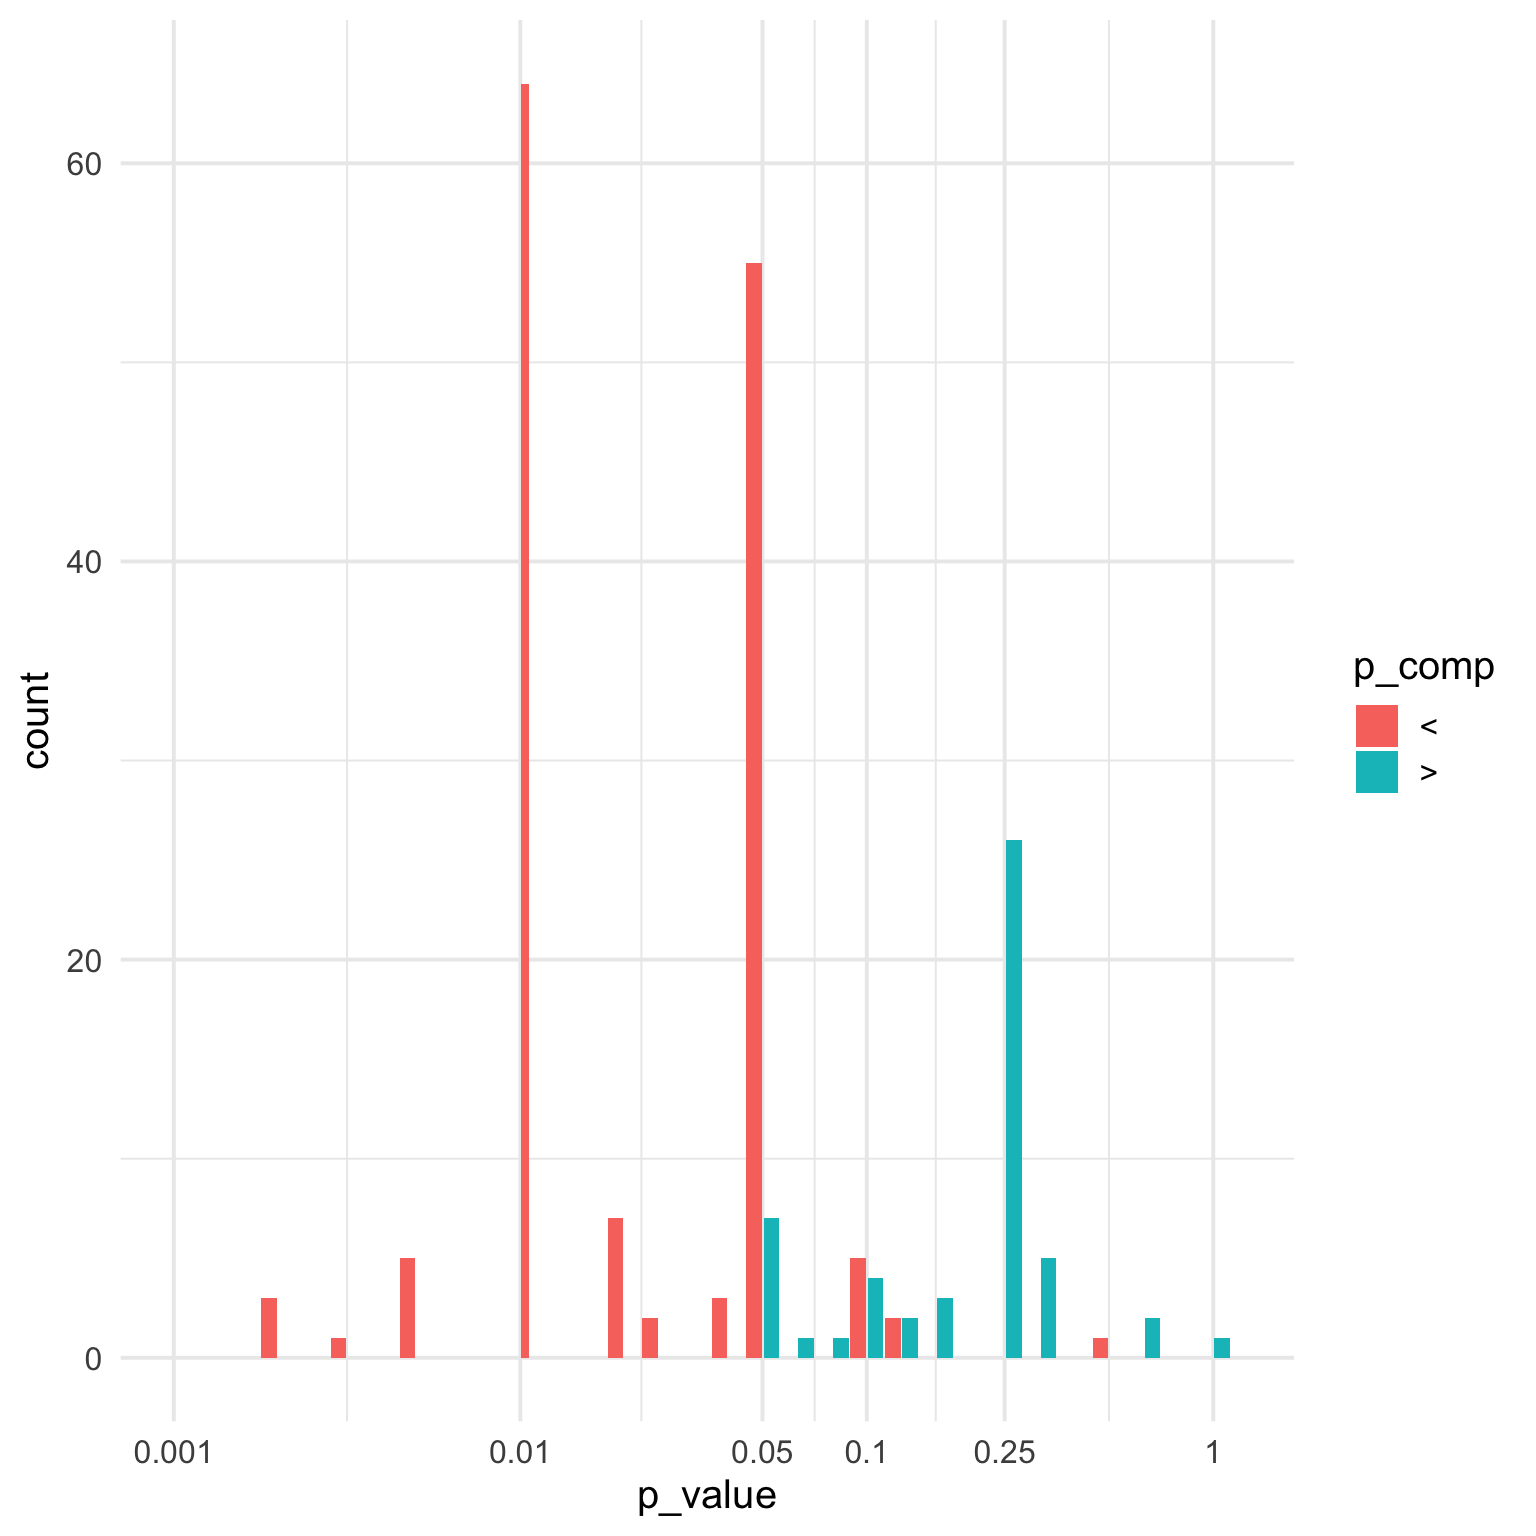
I think the plot looks better rotated, so I’ll use ggplot2::coord_flip() and set the axis breaks to the most common values, plus clean up the labels.
breaks <- c(.001, .002, .005, .01, .02, .05, .1, .25, 1)
total_papers <- unique(p_better$id) |> length()

ggplot(p_better, aes(x = p_value, fill = p_comp)) +
  geom_histogram(binwidth = 0.1,
                 position = position_dodge(width = 0.05)) +
  scale_x_log10(limits = c(.001, 1.1),
                breaks = breaks,
                labels = breaks) +
  scale_fill_manual(values = c("firebrick", "dodgerblue"),
                    labels = c("p < less than", "p > greater than")) +
  labs(title = "The Distribution of Imprecise P-Values in Results Sections",
       subtitle = paste0(total_papers, "/", length(psychsci),
          " Open Access Psychological Science Papers"),
       x = "P-Value (log10 scale)",
       y = "Number of P-Values",
       fill = "",
       caption = "debruine.github.io/30DCC-2025/04-big-or-small") +
  coord_flip() +
  theme(legend.position = c(0.75, 0.85),
        plot.caption = element_text(color = "dodgerblue"))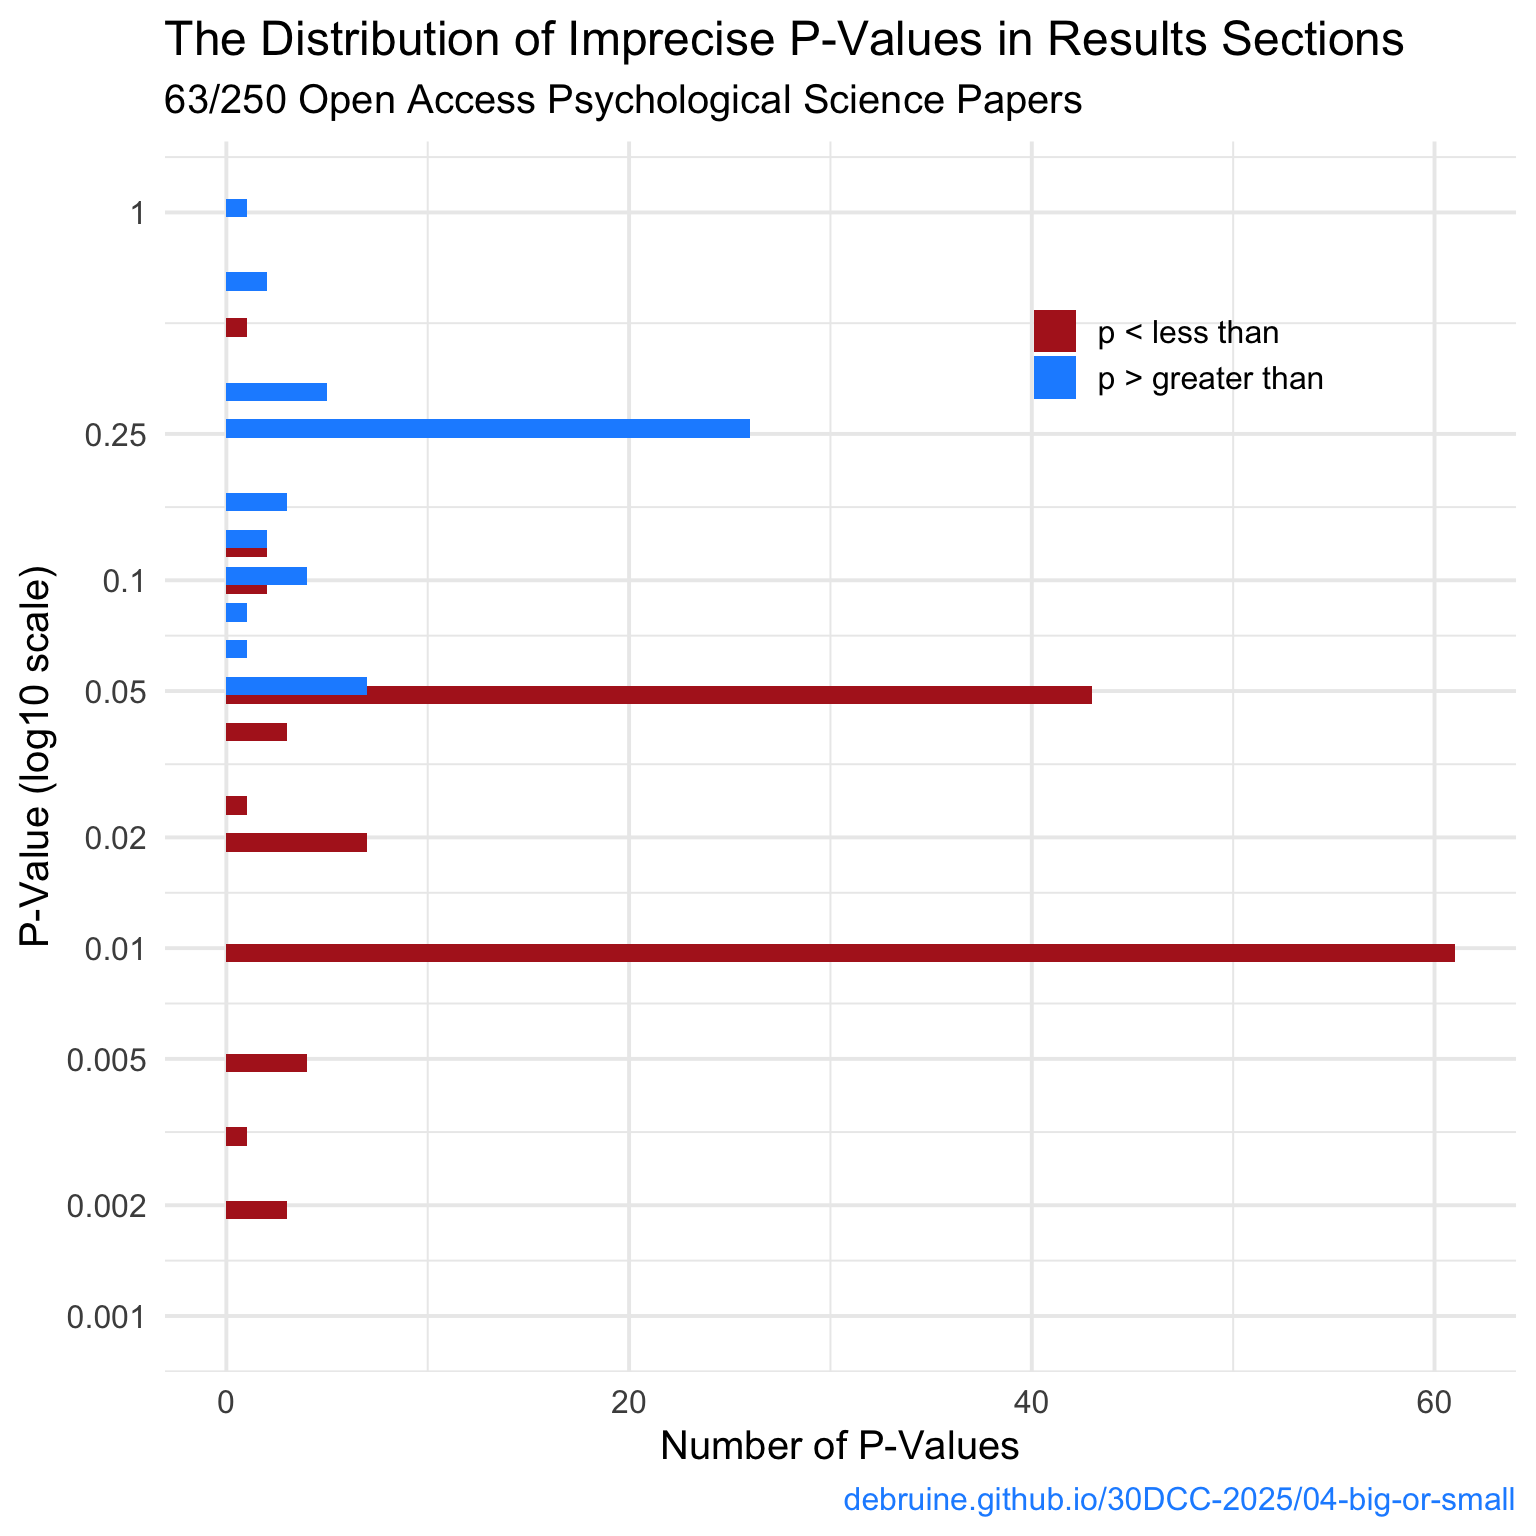
p < .01, p < .05, and p > .25, with smaller peaks at p > .05, p < .02 and p < .005.