Simulate from Existing Data
library(faux)
library(tidyverse)
I added a new function to the package faux to generate a new dataframe from an existing dataframe, simulating all numeric columns from normal distributions with the same mean and SD as the existing data and the same correlation structure as the existing data. (Update: faux is now on CRAN!)
For example, here is the relationship between speed and distance in the built-in dataset cars.
cars %>%
  ggplot(aes(speed, dist)) +
  geom_point() +
  geom_smooth(method = "lm")
## `geom_smooth()` using formula 'y ~ x'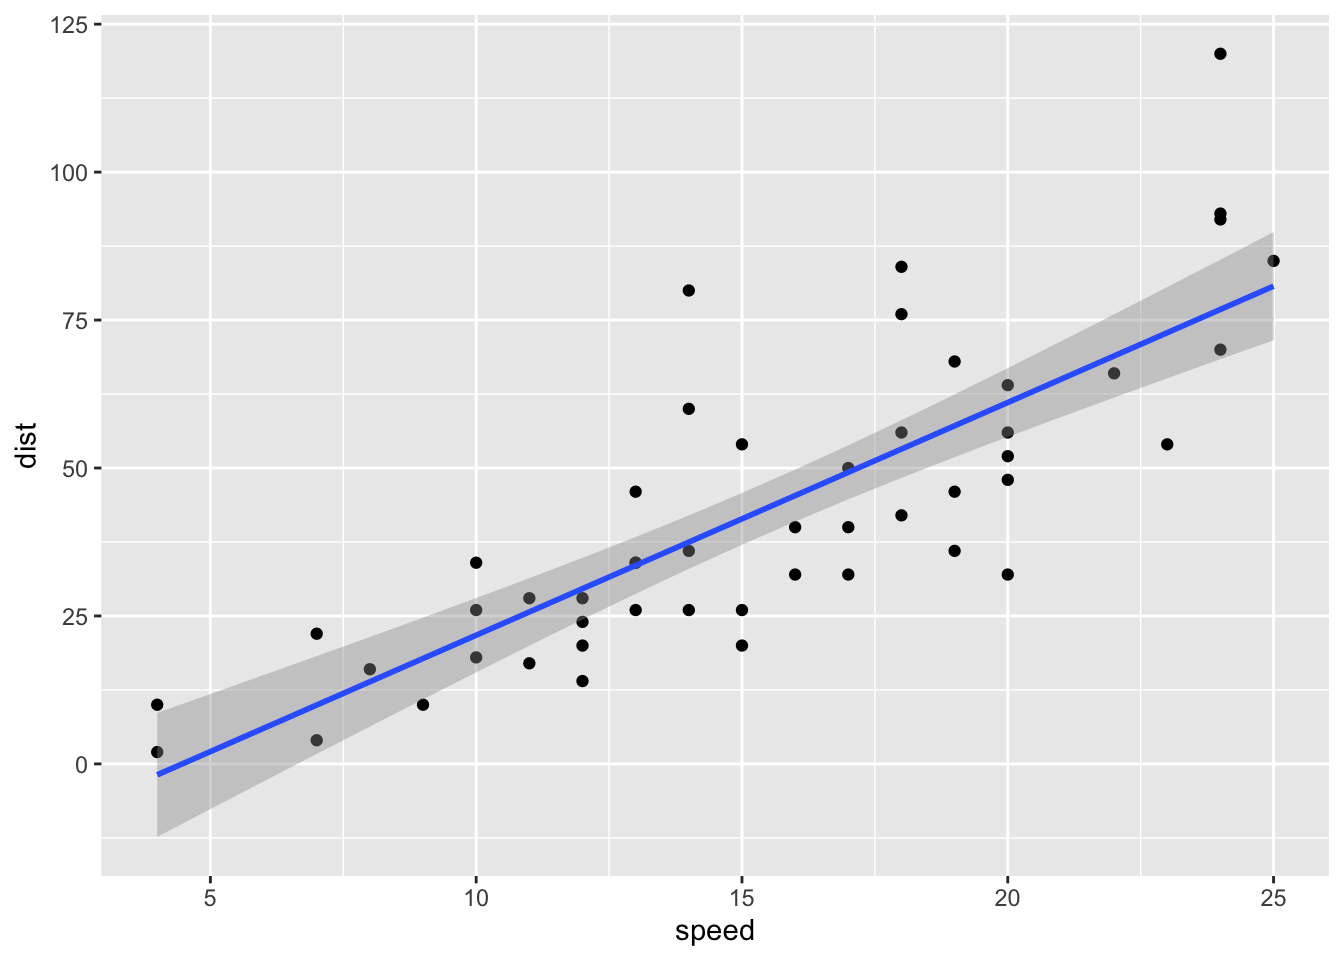
Figure 1: Original cars dataset
You can create a new sample with the same parameters and 500 rows with the code sim_df(cars, 500).
sim_df(cars, 500) %>%
  ggplot(aes(speed, dist)) +
    geom_point() +
    geom_smooth(method = "lm")
## `geom_smooth()` using formula 'y ~ x'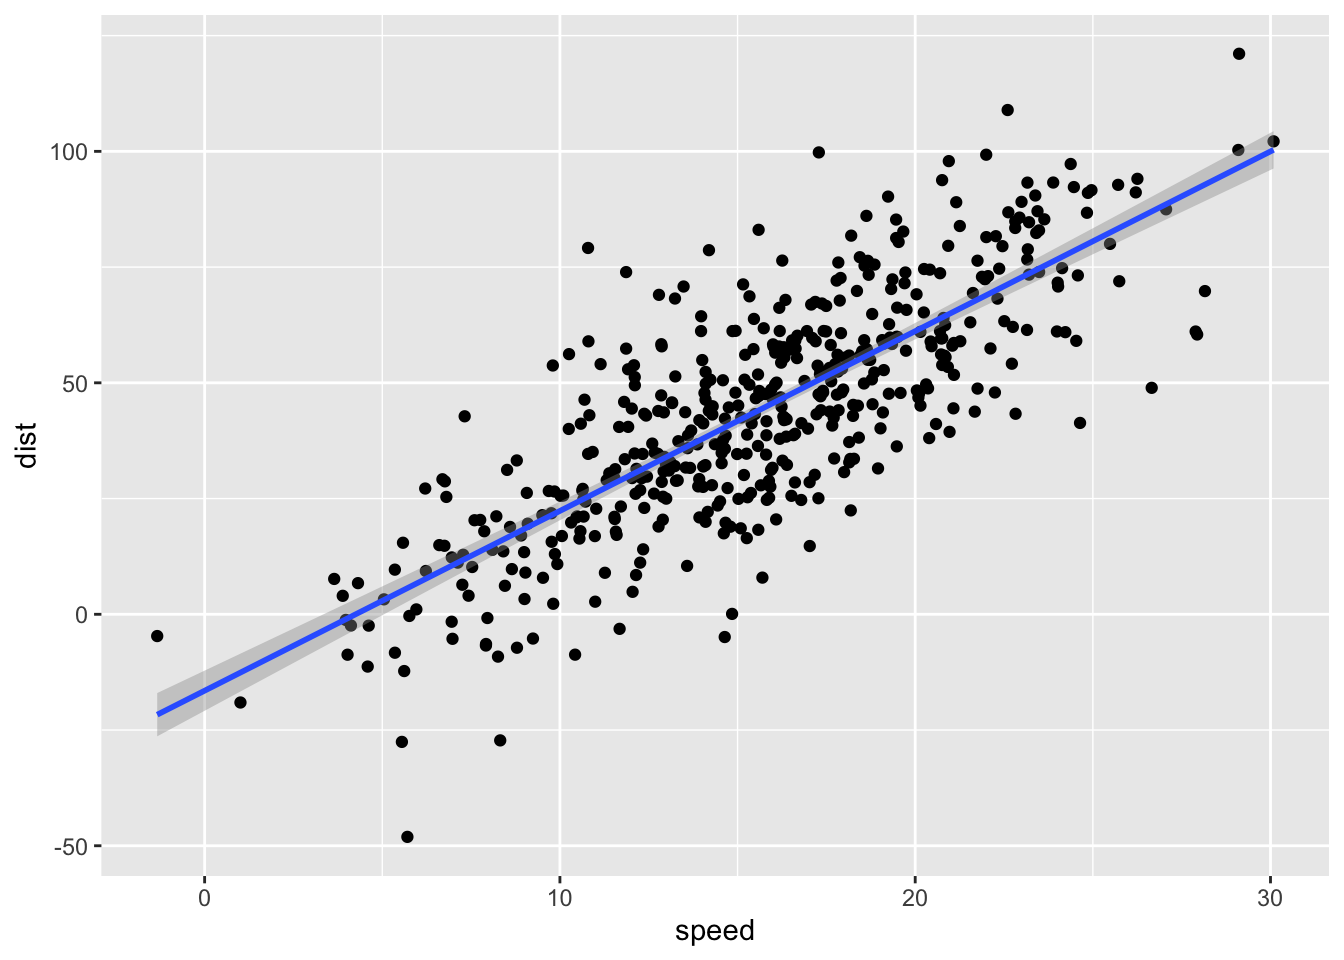
Figure 2: Simulated cars dataset
You can also optionally add grouping variables. For example, here is the relationship between sepal length and width in the built-in dataset iris.
iris %>%
  ggplot(aes(Sepal.Width, Sepal.Length, color = Species)) +
  geom_point() +
  geom_smooth(method = "lm")
## `geom_smooth()` using formula 'y ~ x'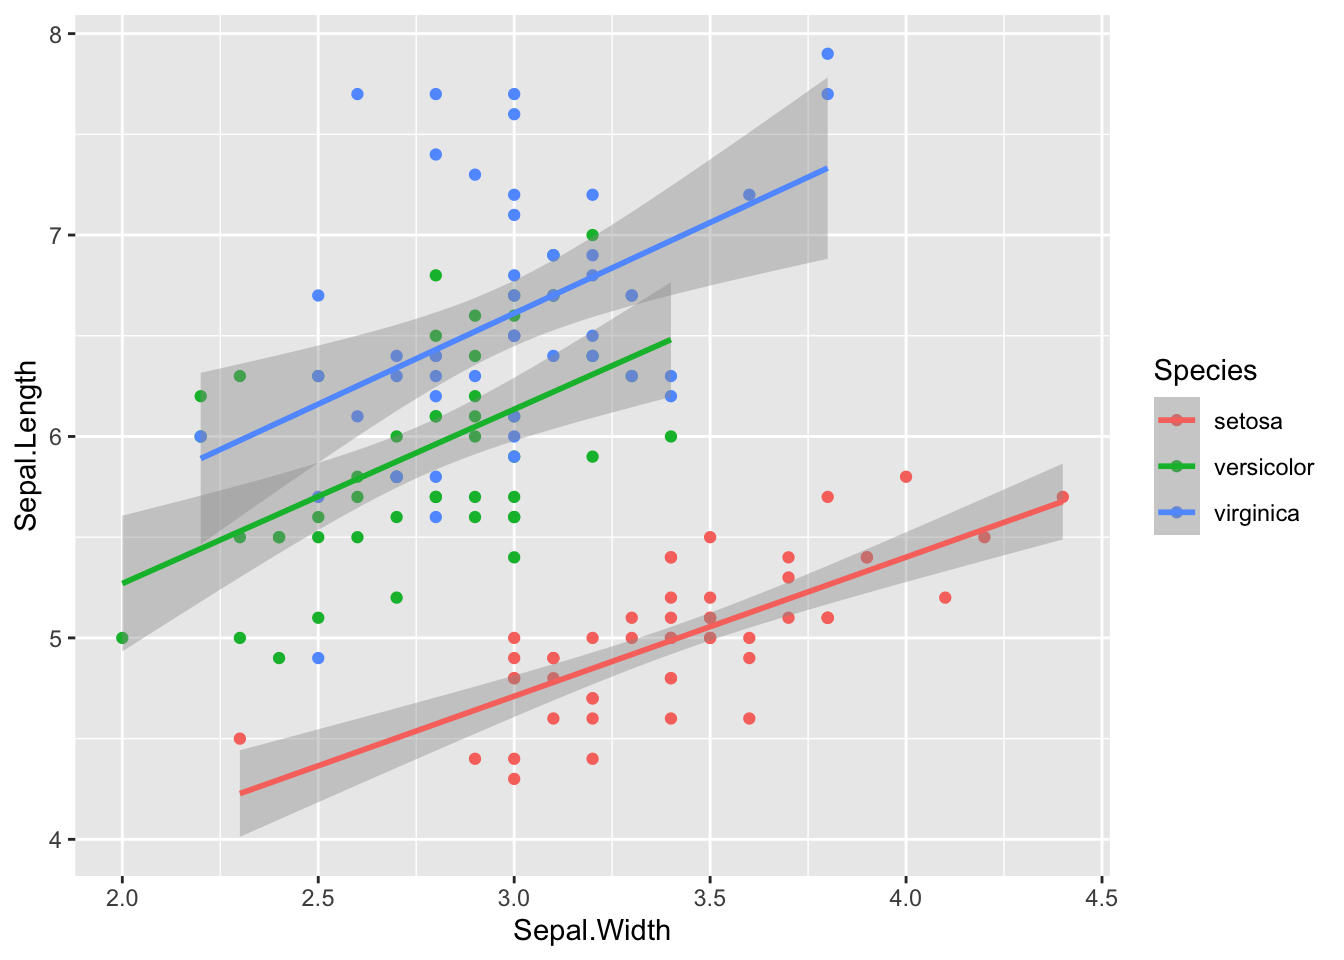
Figure 3: Original iris dataset
And here is a new sample with 50 observations of each species, made with the code sim_df(iris, 100, "Species").
sim_df(iris, 50, between = "Species") %>%
  ggplot(aes(Sepal.Width, Sepal.Length, color = Species)) +
  geom_point() +
  geom_smooth(method = "lm")
## `geom_smooth()` using formula 'y ~ x'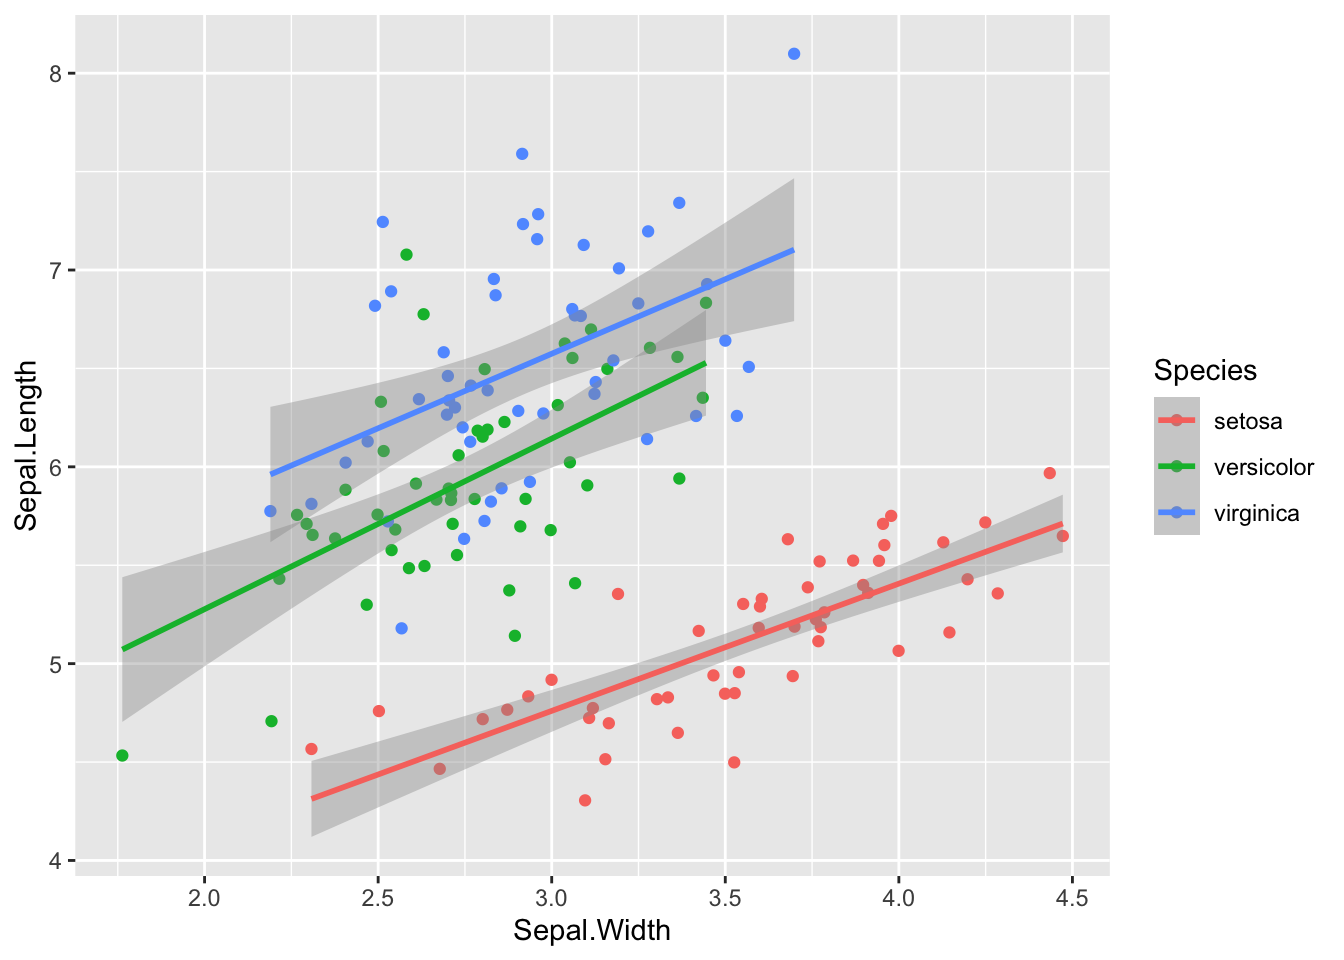
Figure 4: Simulated iris dataset
For now, the function only creates new variables sampled from a continuous normal distribution. I hope to add in other sampling distributions in the future. So you’d need to do any rounding or truncating yourself.
sim_df(iris, 50, between = "Species") %>%
  mutate_if(is.numeric, round, 1) %>%
  ggplot(aes(Sepal.Width, Sepal.Length, color = Species)) +
  geom_point() +
  geom_smooth(method = "lm")
## `geom_smooth()` using formula 'y ~ x'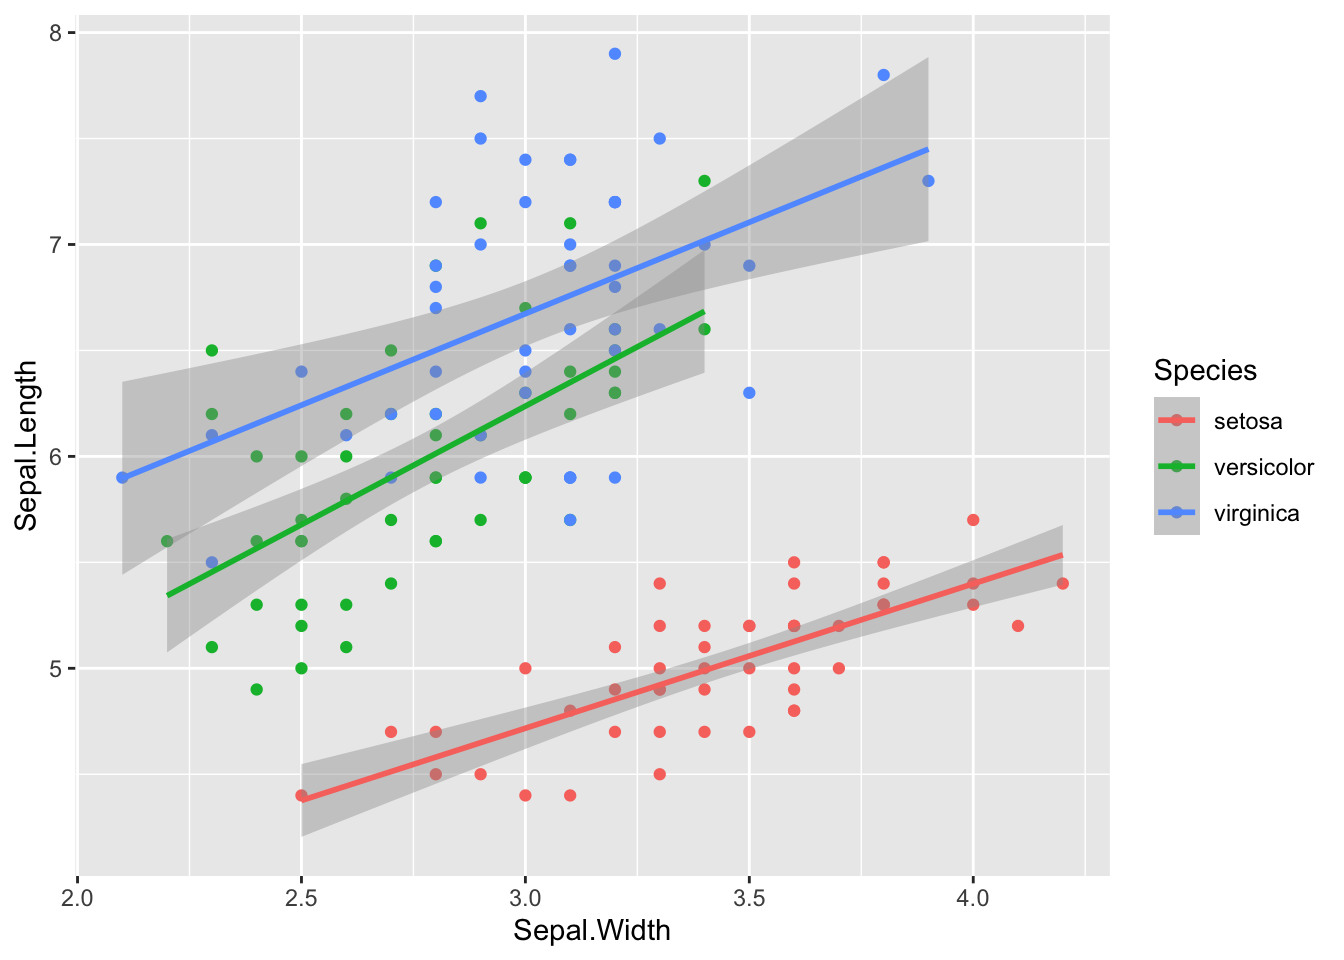
Figure 5: Simulated iris dataset (rounded)