Loops
library(tidyverse)
library(tictoc)
This tutorial will introduce a few ways you can iterate your code. We’ll use the {tictoc} package to time each method to show how they differ.
Task specifics
Let’s say you want to do a power analysis by simulation. You’ll need to simulate some data, run the analysis, and record the relevant p-value. And you’ll need to repeat this procedure a number of times.
Here are all of the simulation parameters you will need for the examples.
# predicted data parameters
n1 <- 50
m1 <- 100
sd1 <- 10
n2 <- 45
m2 <- 105
sd2 <- 11

# critical alpha for calculating power
# doesn't always have to be 0.05 (justify your alpha)
alpha <- 0.05

# number of simulation replications
n_reps <- 10000
One iteration
Your first task when iterating is to sort out the code for a single iteration. Once that is bug-free and doing what you want, you can repeat it.
# simulate data
data1 <- rnorm(n1, m1, sd1)
data2 <- rnorm(n2, m2, sd2)

# analyse it
test <- t.test(data1, data2)

# get the relevant p-value
test$p.value
## [1] 0.000158984For loop
Repeat the code above n_reps times using a for loop. You have to assign the variable i (or whatever you want to call it) to each item in the vector 1:n_reps, but you don’t necessarily have to use i in the code. Here, we use it to add the p-value to the vector p.
tic("for loop")

p <- c()

for (i in 1:n_reps) {
  data1 <- rnorm(n1, m1, sd1)
  data2 <- rnorm(n2, m2, sd2)

  test <- t.test(data1, data2)

  p[i] <- test$p.value
}

# calculcate power as % < alpha
power <- mean(p < alpha)

toc()
## for loop: 1.456 sec elapsedIf you pre-allocate the vector p, this can speed up your loops. This means defining an empty vector with a length of n_reps before you start the loop. This saves the time it takes to delete the vector and make a new, larger one on each iteration. It doesn’t really make much difference for our simple code here.
tic("pre-allocate")

# pre-allocate vector for p-values
p <- vector("numeric", length = n_reps)

for (i in 1:n_reps) {
  data1 <- rnorm(n1, m1, sd1)
  data2 <- rnorm(n2, m2, sd2)

  test <- t.test(data1, data2)

  p[i] <- test$p.value
}

power <- mean(p < alpha)

toc()
## pre-allocate: 1.399 sec elapsedreplicate
The replicate() function lets you iterate the exact same code and collect the output.
tic("replicate")

p <- replicate(n_reps, {
  data1 <- rnorm(n1, m1, sd1)
  data2 <- rnorm(n2, m2, sd2)

  test <- t.test(data1, data2)

  test$p.value
})

power <- mean(p < alpha)

toc()
## replicate: 1.499 sec elapsedYou can enclose the relevant code in a named function and replicate that. This can be useful if you need to run different values.
tic("replicate-function")

# define a simulation function
sim_func <- function(n1, m1, sd1, n2, m2, sd2) {
  data1 <- rnorm(n1, m1, sd1)
  data2 <- rnorm(n2, m2, sd2)

  test <- t.test(data1, data2)

  test$p.value
}

# repeat the sim function with different sd1 and m2 values
p <- replicate(n_reps, sim_func(50, 100, 9.5, 45, 102, 11))

power <- mean(p < alpha)

toc()
## replicate-function: 1.676 sec elapsedapply
The apply functions can be used to iterate over a vector or list. Here, we’re iterating over the vector 1:n_reps. The function needs to have an argument i for these values, but we don’t actually need to use i in the function code. Here, we don’t assign the p-value to a vector p inside the function, but rather return the p-value from the function and the sapply() function simplifies this into a vector, which is then assigned to p.
tic("apply")
p <- sapply(1:n_reps, function(i) {
  data1 <- rnorm(n1, m1, sd1)
  data2 <- rnorm(n2, m2, sd2)

  test <- t.test(data1, data2)

  test$p.value
})

power <- mean(p < alpha)

toc()
## apply: 1.756 sec elapsedIf you want to use the apply functions with a function that takes arguments, either the first argument should be i for the replication index, or you can repeat the first argument n_reps times.
tic("apply-function")

sim_func <- function(i, n1, m1, sd1, n2, m2, sd2) {
  data1 <- rnorm(n1, m1, sd1)
  data2 <- rnorm(n2, m2, sd2)

  test <- t.test(data1, data2)

  test$p.value
}

# you can only iterate over 1 argument
# the rest must be single values
p <- sapply(1:n_reps, sim_func,
            n1 = 50, m1 = 100, sd1 = 9.5,
            n2 = 45, m2 = 102, sd2 = 11)

power <- mean(p < alpha)

toc()
## apply-function: 1.687 sec elapsedYou can also split up the data simulation and analysis steps into two different apply functions. In the first one, you iterate over the vector 1:n_reps and in the second, you iterate over each item in the data list.
tic("apply2")

# simulate data as a list of lists
data <- lapply(1:n_reps, function(i) {
  list(
    data1 = rnorm(n1, m1, sd1),
    data2 = rnorm(n2, m2, sd2)
  )
})

# iterate over list items
p <- sapply(data, function(d) {
  test <- t.test(d$data1, d$data2)

  test$p.value
})

power <- mean(p < alpha)

toc()
## apply2: 2.098 sec elapsedIf you use sapply() for the data simulation, it will simplify the result into a matrix. Then you need to use apply() to iterate over the columns of the matrix.
tic("apply3")

# simulate data as a matrix
data <- sapply(1:n_reps, function(i) {
  list(
    data1 = rnorm(n1, m1, sd1),
    data2 = rnorm(n2, m2, sd2)
  )
})

# iterate over columns
p <- apply(data, MARGIN = 2, function(d) {
  test <- t.test(d$data1, d$data2)

  test$p.value
})

power <- mean(p < alpha)

toc()
## apply3: 1.908 sec elapsedThe mapply() function takes any number of arguments (the function goes first). You can use this to iterate over different values of the arguments, but this can get a little tricky to keep track of, so I like to organise each iteration in a row of a data frame first.
tic("mapply")

# make a data frame with 1 row for each replicate
params <- tidyr::crossing(
  rep = 1:2000,
  n1 = 50,
  m1 = 100,
  sd1 = 10,
  n2 = 45,
  m2 = 100:110,
  sd2 = 11
)

sim_func <- function(n1, m1, sd1, n2, m2, sd2) {
  data1 <- rnorm(n1, m1, sd1)
  data2 <- rnorm(n2, m2, sd2)

  test <- t.test(data1, data2)

  test$p.value
}

p <- mapply(sim_func,
            n1 = params$n1, m1 = params$m1, sd1 = params$sd1,
            n2 = params$n2, m2 = params$m2, sd2 = params$sd2)

toc()
## mapply: 3.284 sec elapsed# add p to the params table and
# calculate power for each param combo
power <- params |>
mutate(p = p) |>
group_by(n1, n2, m1, m2, sd1, sd2) |>
summarise(power = mean(p < alpha),
.groups = "drop")
# plot power by m2 - m1
ggplot(power, aes(x = m2 - m1, y = power)) +
geom_line() +
geom_point() +
scale_x_continuous(name = "Raw Effect Size", breaks = 0:10) +
scale_y_continuous(limits = c(0, 1)) +
theme_minimal(base_size = 14)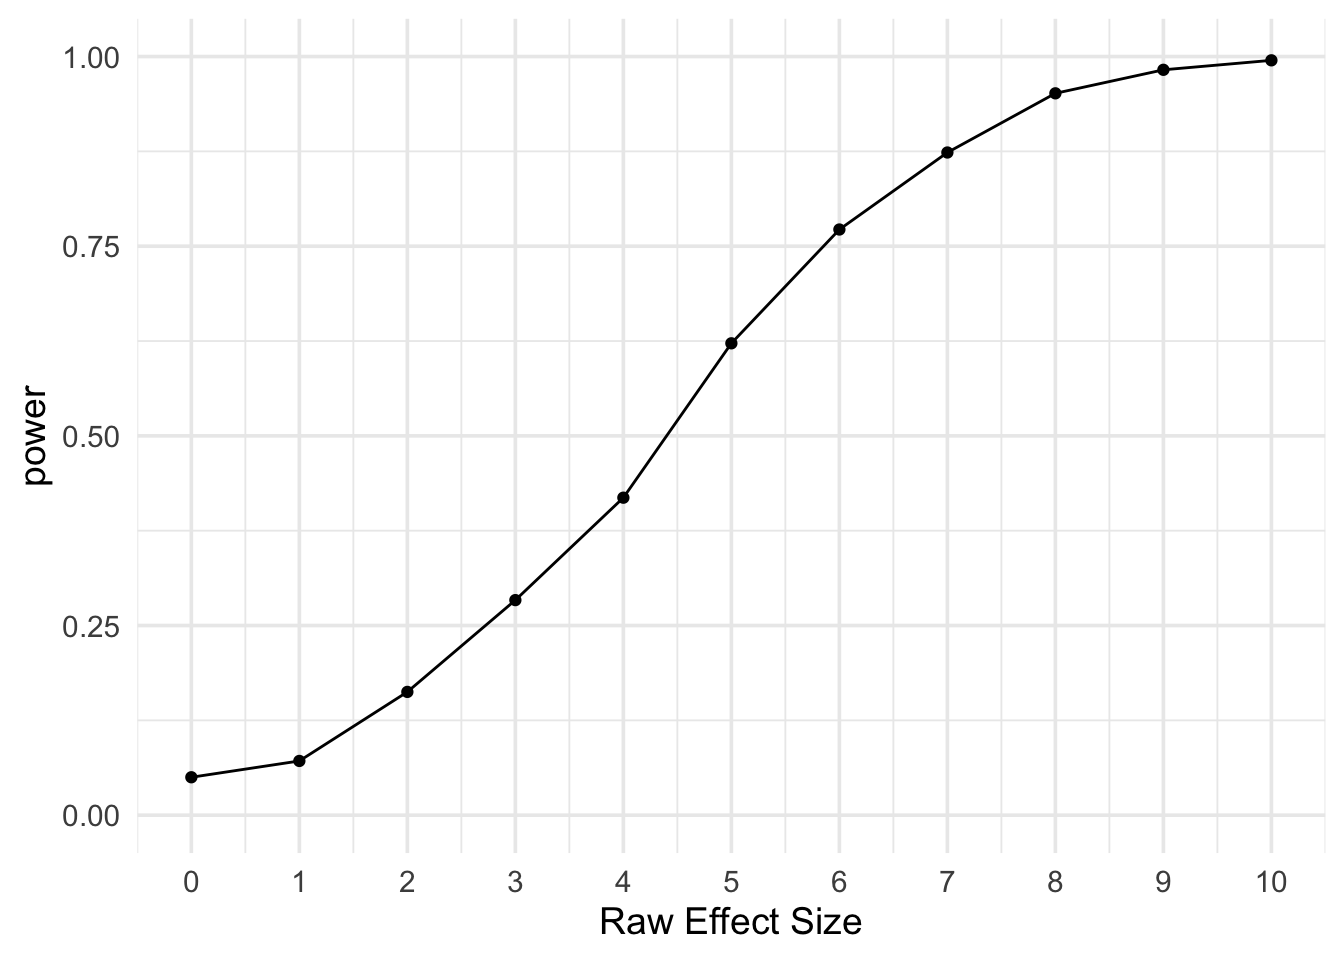
purrr
The {purrr} package has iteration functions that work a lot like the apply functions, with some extra helpful features (most of which we won’t explore here).
The function map_dbl() is like sapply() in that it returns a vector, but more specific in that it requires the results of the function be a double.
tic("map")
p <- map_dbl(1:n_reps, function(i) {
data1 <- rnorm(n1, m1, sd1)
data2 <- rnorm(n2, m2, sd2)
test <- t.test(data1, data2)
test$p.value
})
power <- mean(p < alpha)
toc()## map: 2.142 sec elapsedYou can also split up the data simulation and analysis like above. The map() function returns a list.
tic("map-split")
# simulate data as a list of lists
data <- map(1:n_reps, function(i) {
list(
data1 = rnorm(n1, m1, sd1),
data2 = rnorm(n2, m2, sd2)
)
})
# iterate over list items
p <- map_dbl(data, function(d) {
test <- t.test(d$data1, d$data2)
test$p.value
})
power <- mean(p < alpha)
toc()## map-split: 1.763 sec elapsedThe pmap() function is really useful if you want to run a simulation across a lot of different parameters. Use tidyr::crossing() to make a data frame with one row for each replicate. Add ... to the arguments in the function inside pmap() so it can ignore any unused columns in the params table (e.g., rep).
tic("pmap")
# make a data frame with 1 row for each replicate
params <- tidyr::crossing(
rep = 1:n_reps,
n1 = n1,
m1 = m1,
sd1 = sd1,
n2 = n2,
m2 = m2,
sd2 = sd2
)
# simulate data as a list of lists
data <- pmap(params, function(n1, m1, sd1, n2, m2, sd2, ...) {
list(
data1 = rnorm(n1, m1, sd1),
data2 = rnorm(n2, m2, sd2)
)
})
# iterate over list items
p <- map_dbl(data, function(d) {
test <- t.test(d$data1, d$data2)
test$p.value
})
power <- mean(p < alpha)
toc()## pmap: 1.826 sec elapsedIn this way, we could explore a range of values, such as how the results change as m2 varies from 100 to 110.
# make a data frame with 1 row for each replicate
params <- tidyr::crossing(
rep = 1:2000,
n1 = 50,
m1 = 100,
sd1 = 10,
n2 = 45,
m2 = 100:110,
sd2 = 11
)
p <- pmap_dbl(params, function(n1, m1, sd1, n2, m2, sd2,...) {
data1 = rnorm(n1, m1, sd1)
data2 = rnorm(n2, m2, sd2)
test <- t.test(data1, data2)
test$p.value
})
# add p to the params table and
# calculate power for each param combo
power <- params |>
  mutate(p = p) |>
  group_by(n1, n2, m1, m2, sd1, sd2) |>
  summarise(power = mean(p < alpha),
            .groups = "drop")

# plot power by m2 - m1
ggplot(power, aes(x = m2 - m1, y = power)) +
  geom_line() +
  geom_point() +
  scale_x_continuous(name = "Raw Effect Size", breaks = 0:10) +
  scale_y_continuous(limits = c(0, 1)) +
  theme_minimal(base_size = 14)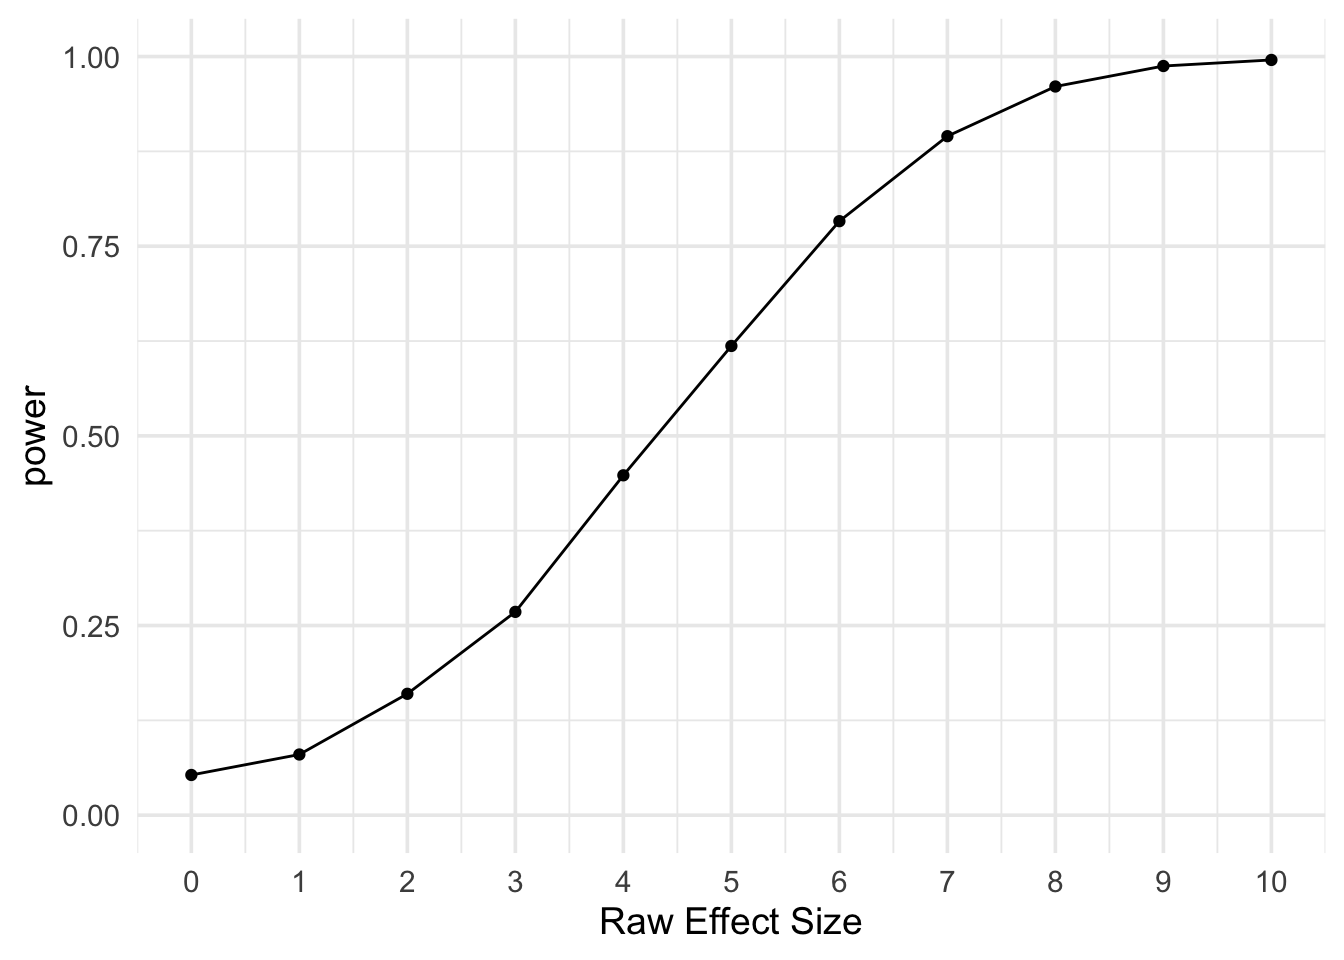
foreach
If you have a ton of iterations or each is slow, you might want to run the iterations in parallel. These functions use the {foreach} package.
First, set up the basic loop using the foreach() function and %do% syntax. We’ll up the number of replications to 1e5.
library(foreach)##
## Attaching package: 'foreach'## The following objects are masked from 'package:purrr':
##
## accumulate, whenn_reps <- 1e5tic("foreach")
sim_func <- function(i) {
data1 = rnorm(n1, m1, sd1)
data2 = rnorm(n2, m2, sd2)
test <- t.test(data1, data2)
test$p.value
}
p <- foreach(i= 1:n_reps) %do% sim_func(i)
power <- mean(p < alpha)
toc()## foreach: 49.59 sec elapsedThan change %do% to %dopar% to take advantage of parallelisation if your computer has the capacity.
# set up parallelisation
library(doParallel)
## Loading required package: iterators## Loading required package: parallelregisterDoParallel()
getDoParWorkers() # find out how many workers## [1] 4tic("foreach-parallel")
sim_func <- function(i) {
data1 = rnorm(n1, m1, sd1)
data2 = rnorm(n2, m2, sd2)
test <- t.test(data1, data2)
test$p.value
}
p <- foreach(i= 1:n_reps) %dopar% sim_func(i)
power <- mean(p < alpha)
toc()## foreach-parallel: 26.711 sec elapsedAlternatively, you can use times() like replicate().
tic("times-parallel")

sim_func <- function() {
  data1 = rnorm(n1, m1, sd1)
  data2 = rnorm(n2, m2, sd2)

  test <- t.test(data1, data2)

  test$p.value
}

p <- times(n_reps) %dopar% sim_func()

power <- mean(p < alpha)

toc()
## times-parallel: 20.183 sec elapsedLisa DeBruine
Professor of Psychology
Lisa DeBruine is a professor of psychology at the University of Glasgow. Her substantive research is on the social perception of faces and kinship. Her meta-science interests include team science (especially the Psychological Science Accelerator), open documentation, data simulation, web-based tools for data collection and stimulus generation, and teaching computational reproducibility.