Visualise a template on an image.
Arguments
- stimuli
list of stimuli
- pt.color, line.color
line or point color, see
color_conv()- pt.alpha, line.alpha
transparency (0-1), ignored if color is a hex value with transparency. Set alpha to 0 to omit lines or points.
- pt.size, line.size
size in pixels (scales to image size if NULL)
- pt.shape
the shape of the points ("circle", "cross", "index")
- bg
background color ("image" uses the original image)
See also
Template functions
auto_delin(),
average_tem(),
centroid(),
change_lines(),
delin(),
features(),
get_point(),
remove_tem(),
require_tems(),
same_tems(),
squash_tem(),
subset_tem(),
tem_def(),
viz_tem_def()
Visualisation functions
as_ggplot(),
gglabel(),
label(),
mlabel(),
plot.stimlist(),
plot.stim(),
plot_rows(),
plot_stim()
Examples
# get an image with 2 different templates
stimuli <- demo_tems("frl|fpp106")
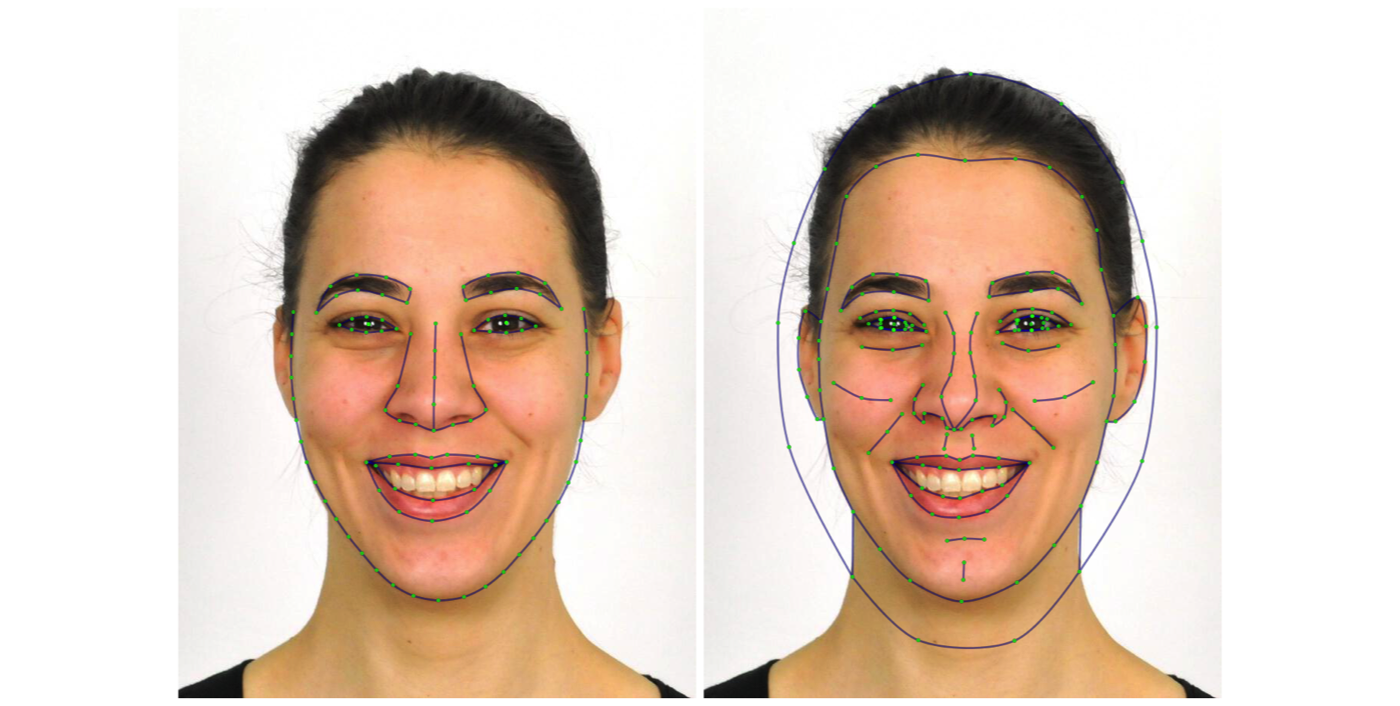
# default template
draw_tem(stimuli)
 # \donttest{
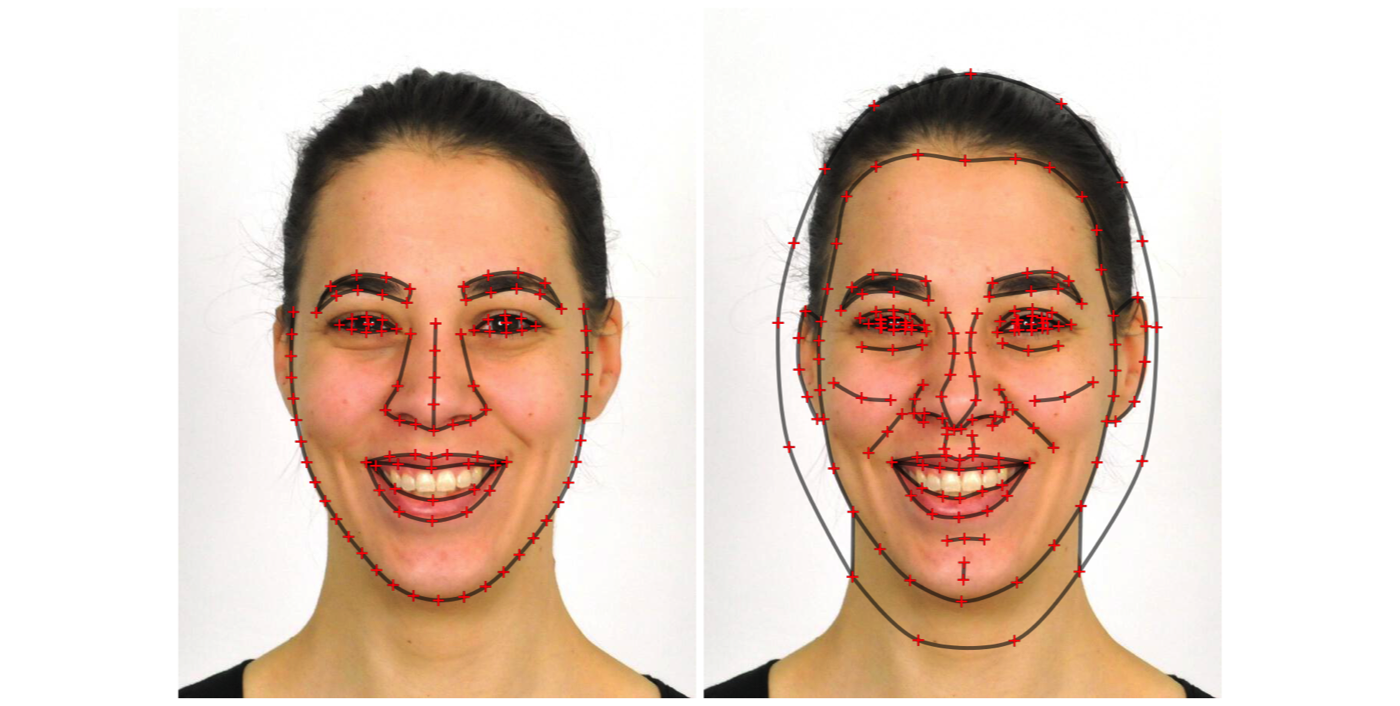
# custom template
draw_tem(stimuli,
pt.shape = "cross",
pt.color = "red",
pt.alpha = 1,
pt.size = 15,
line.color = rgb(0, 0, 0),
line.alpha = 0.5,
line.size = 5)
# \donttest{
# custom template
draw_tem(stimuli,
pt.shape = "cross",
pt.color = "red",
pt.alpha = 1,
pt.size = 15,
line.color = rgb(0, 0, 0),
line.alpha = 0.5,
line.size = 5)
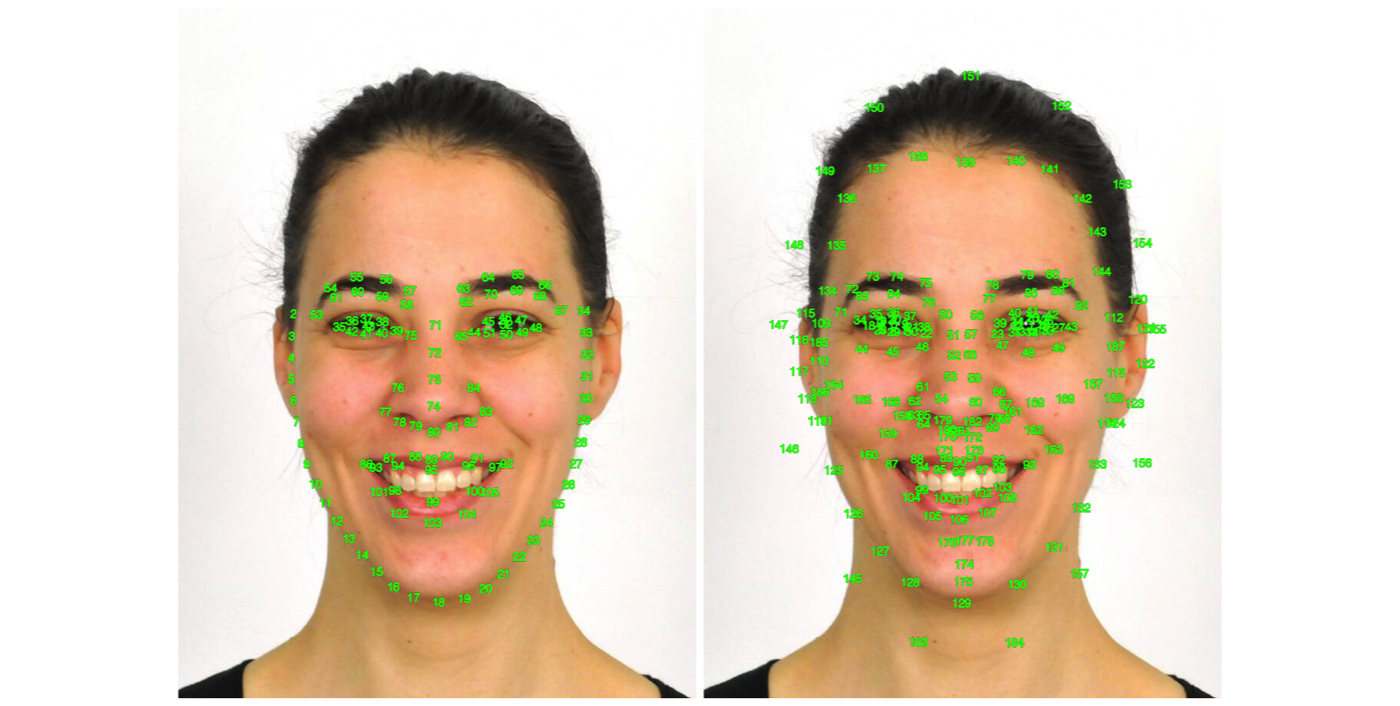
 # indexed template
draw_tem(stimuli,
pt.shape = "index",
pt.size = 15,
pt.alpha = 1,
line.alpha = 0)
# indexed template
draw_tem(stimuli,
pt.shape = "index",
pt.size = 15,
pt.alpha = 1,
line.alpha = 0)
 # }
# }