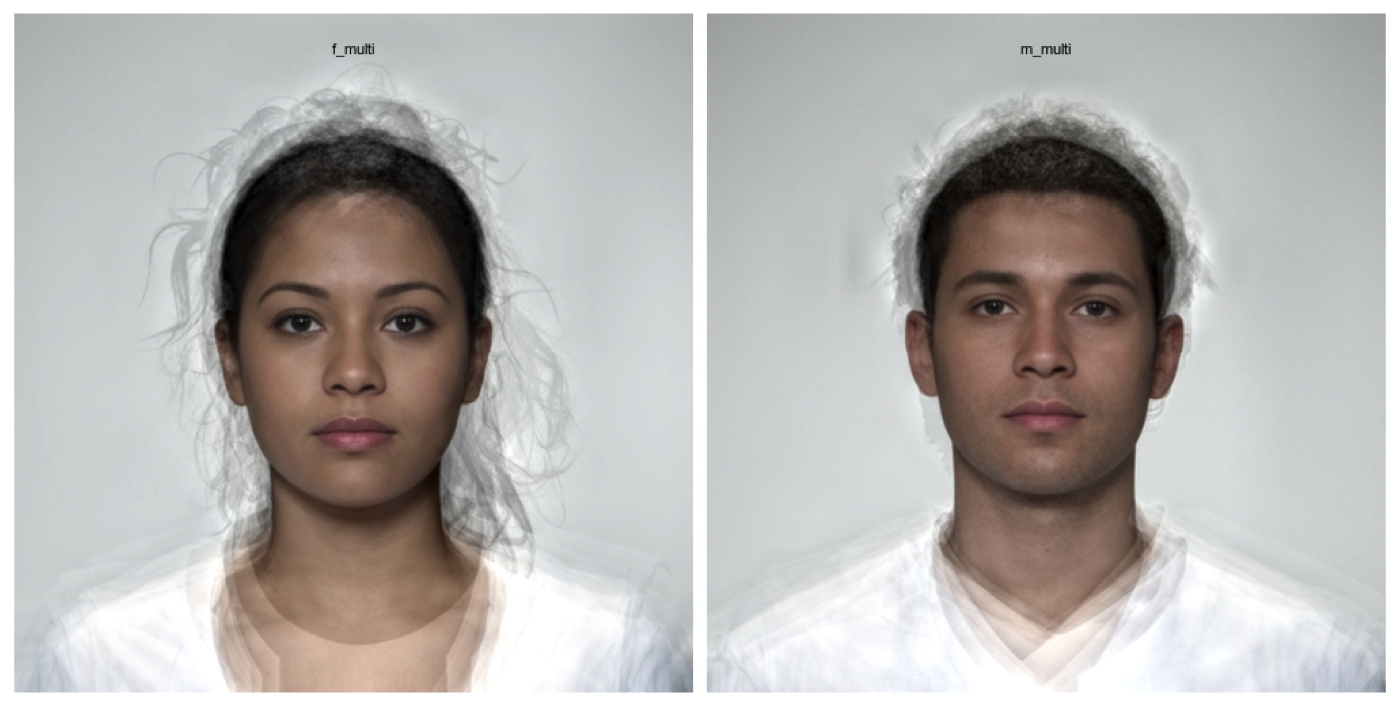
Label image using ggplot2::annotate. All arguments are vectorised over the stimuli and values are recycled or truncated if there are fewer or more than stimuli.
Arguments
- stimuli
list of stimuli
- label
a vector of the label text(s) or TRUE to use stimlist names
- x
x-coordinate for label anchor (left is 0); values <= 1 are interpreted as proportions of width
- y
y-coordinate for label anchor (bottom is 0); values <= 1 are interpreted as proportions of height
- geom
the geom to use
- ...
further arguments to pass to
ggplot2::annotate()
See also
label() for a labeller using syntax like magick::image_annotate
Visualisation functions
as_ggplot(),
draw_tem(),
label(),
mlabel(),
plot.stimlist(),
plot.stim(),
plot_rows(),
plot_stim()
Examples
stimuli <- demo_stim()

# label with image names
# the default text size in ggplot is tiny
gglabel(stimuli)

# \donttest{
# add a watermark
gglabel(stimuli,
        label = "watermark",
        x = 0.5,
        y = 0.5,
        geom = "text",
        size = 30,
        color = "black",
        angle = -30,
        alpha = 0.5)

# }
# }
