Show all the stimuli in a grid. You can use plot() as an alias.
Arguments
- stimuli
list of class stimlist
- nrow
number of rows
- ncol
number of columns
- byrow
fill grid by rows (first ncol images in the first row); if FALSE, fills by columns (first nrow images in the first column)
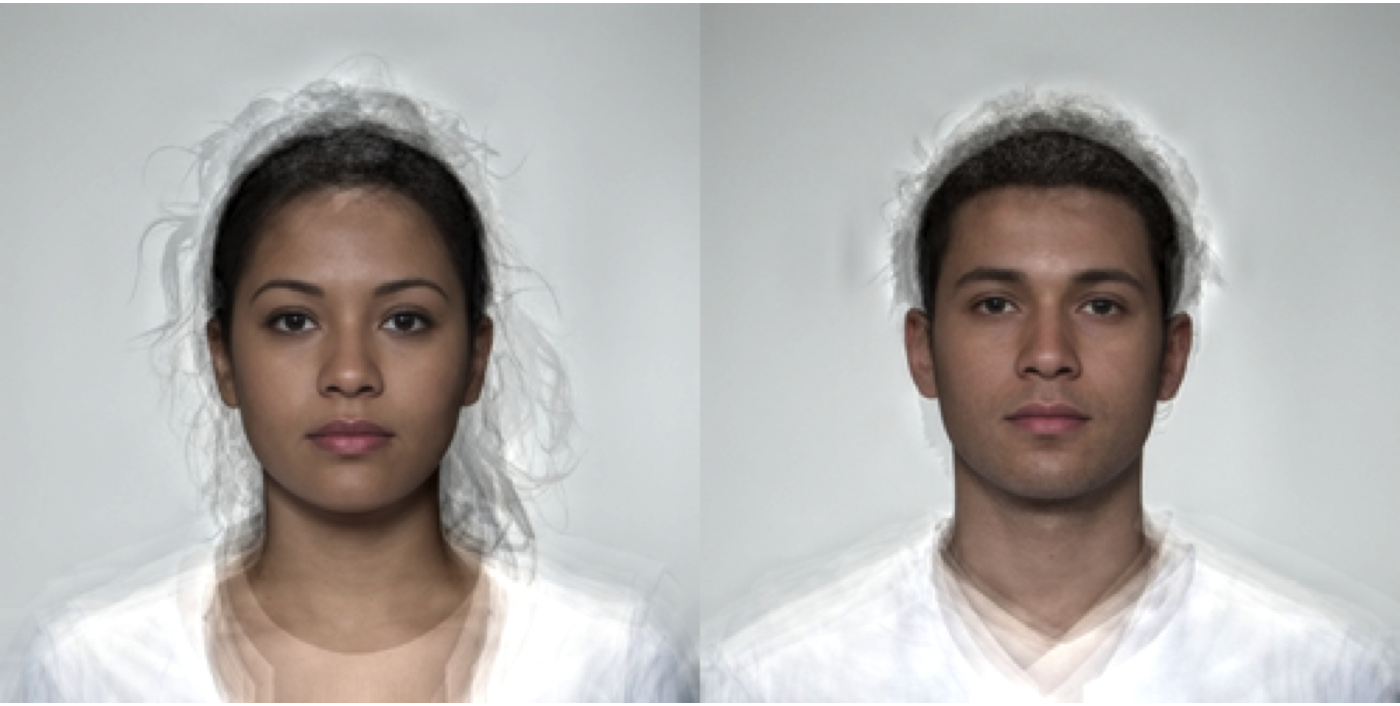
- padding
around each image in pixels
- external_pad
whether to include external padding
- fill
background color, see
color_conv()- maxwidth, maxheight
maximum width and height of grid in pixels
Examples
stimuli <- demo_stim() |> resize(0.5)
plot_stim(stimuli)
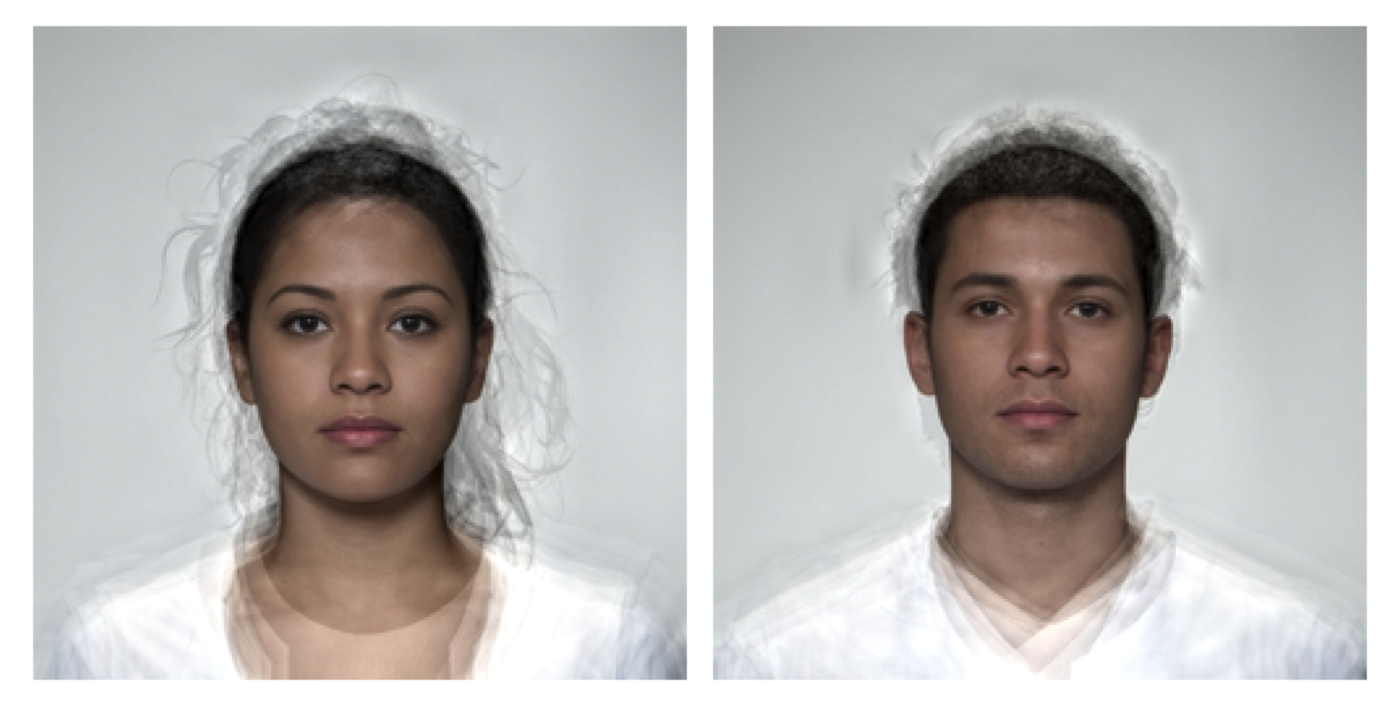 # \donttest{
# default padding is 10px internal and external
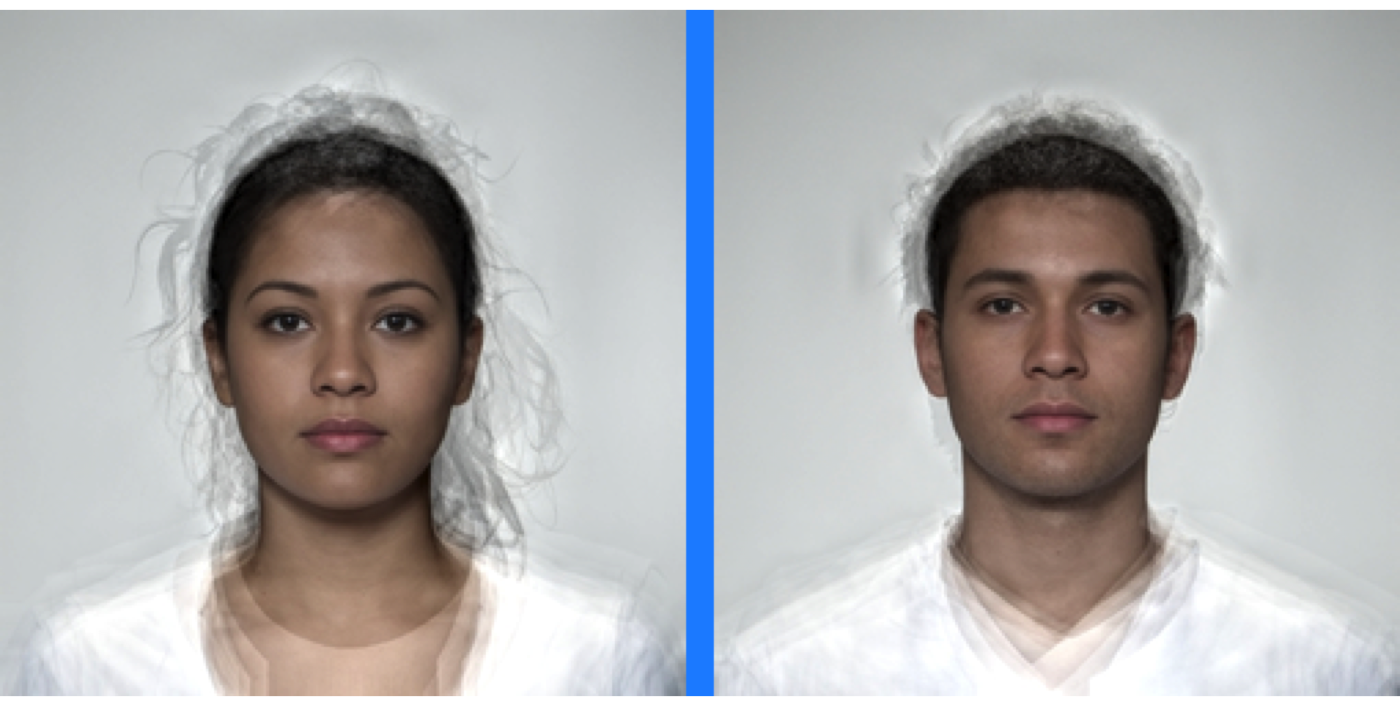
plot(stimuli, fill = "dodgerblue")
 plot(stimuli, external_pad = 0, fill = "dodgerblue")
 plot(stimuli, padding = 0, fill = "dodgerblue")
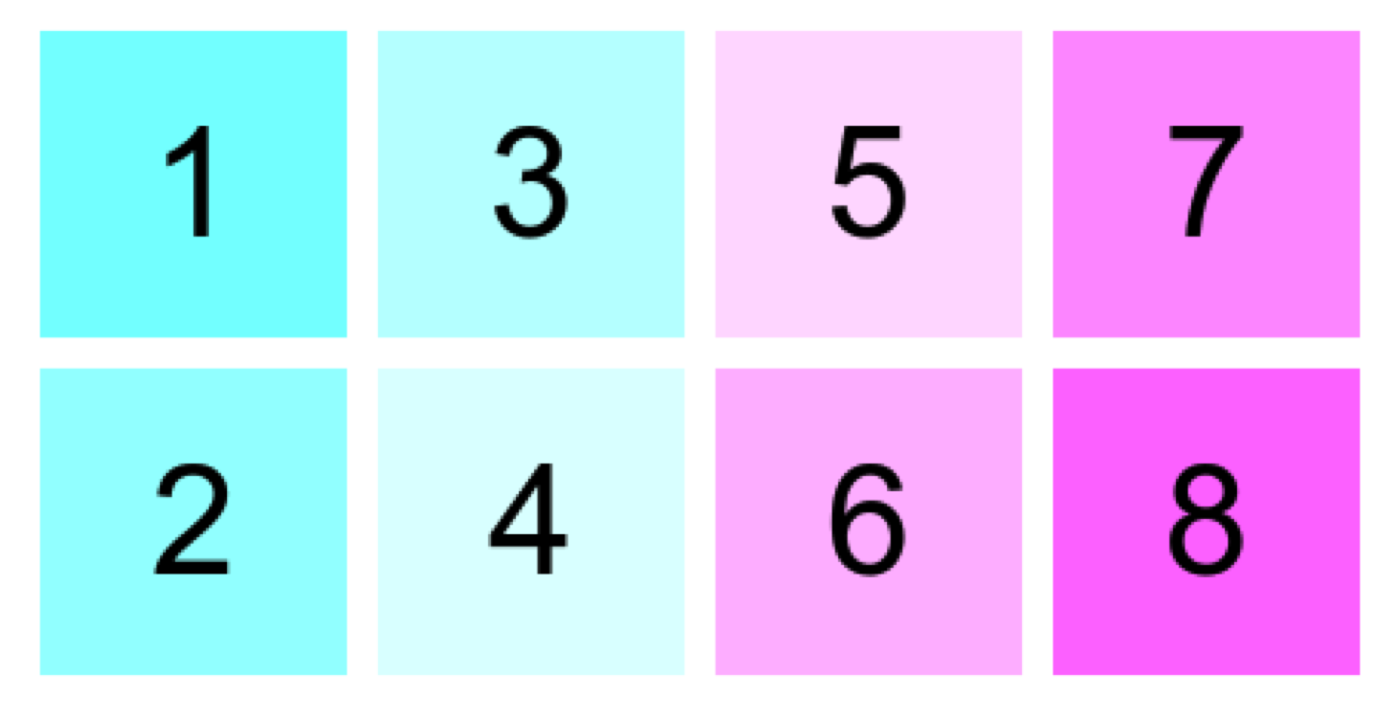
 # make 8 numbered images
n <- blank(8, color = grDevices::cm.colors(8)) |>
label(1:8, gravity = "center", size = 50)
# 2 rows, allocating by row
plot(n, nrow = 2)
 # 2 rows, allocating by column
plot(n, nrow = 2, byrow = FALSE)
 # }
# }
