Usage
beta2norm(x, mu = 0, sd = 1, shape1 = NULL, shape2 = NULL, ...)
Arguments
- x
the gamma distributed vector
- mu
the mean of the normal distribution to convert to
- sd
the SD of the normal distribution to convert to
- shape1, shape2
non-negative parameters of the beta distribution
- ...
further arguments to pass to pbeta (e.g., ncp)
Value
a vector with a normal distribution
Examples
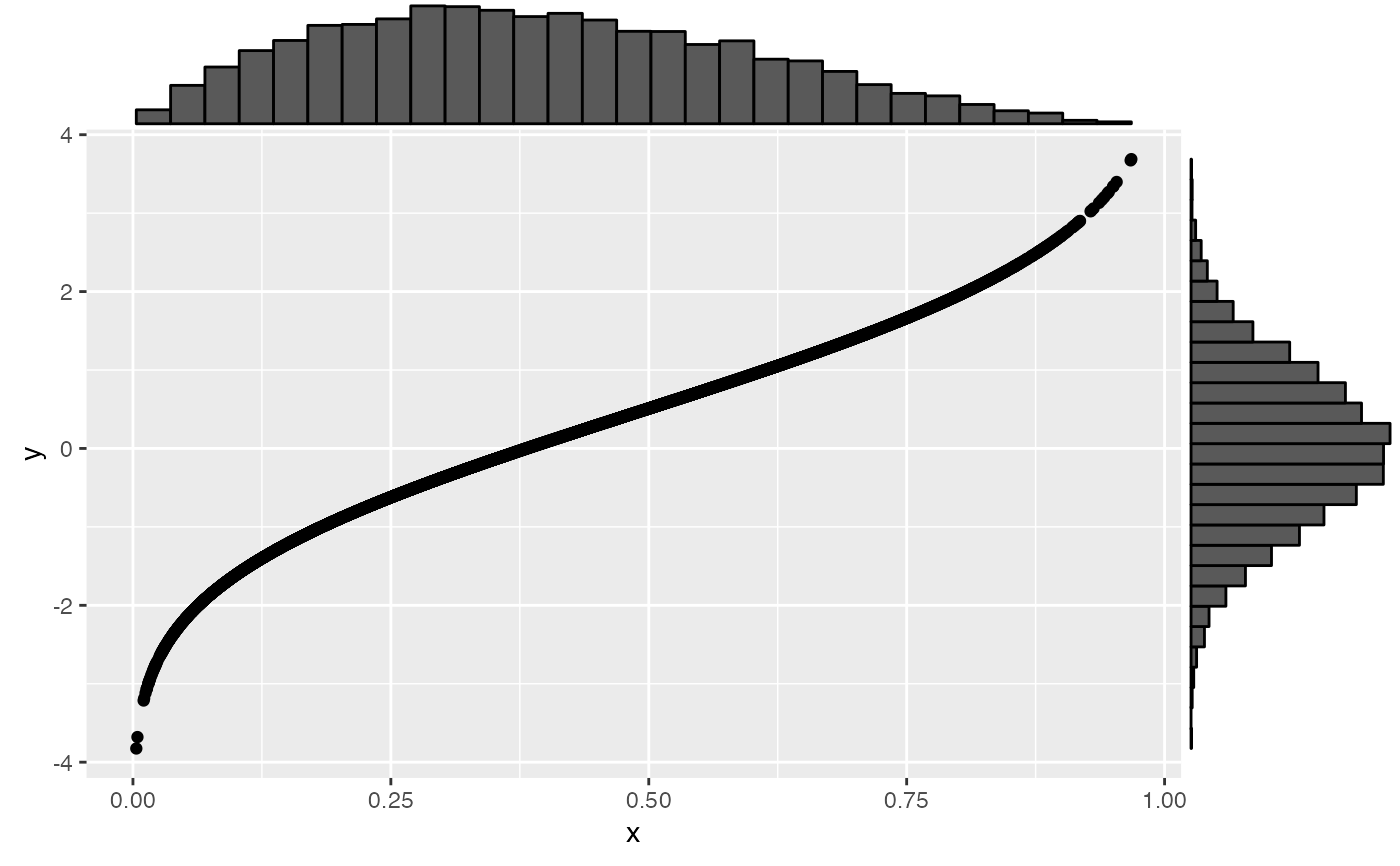
x <- rbeta(10000, 2, 3)
y <- beta2norm(x)
#> shape1 was not set, so guessed as 2.03064148701798
#> shape2 was not set, so guessed as 3.06478809294635
g <- ggplot2::ggplot() + ggplot2::geom_point(ggplot2::aes(x, y))
ggExtra::ggMarginal(g, type = "histogram")


