Convert a negative binomial distribution to a normal (gaussian) distribution with specified mu and sd
Examples
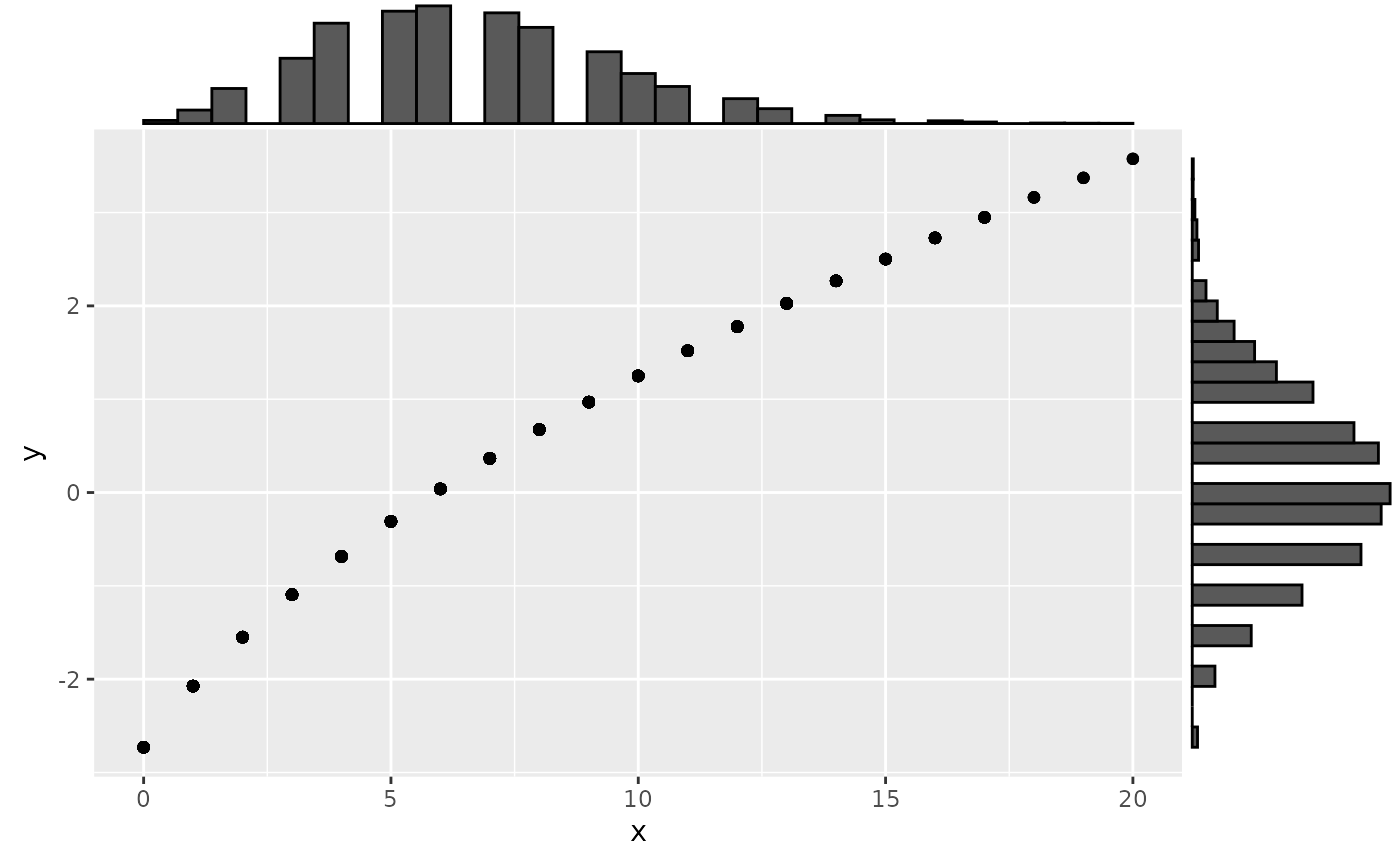
x <- rnbinom(10000, 20, 0.75)
y <- nbinom2norm(x, 0, 1, 20, 0.75)
g <- ggplot2::ggplot() + ggplot2::geom_point(ggplot2::aes(x, y))
ggExtra::ggMarginal(g, type = "histogram")

