Convert normal to likert
Arguments
- x
the normally distributed vector
- prob
a vector of probabilities or counts; if named, the output is a factor
- labels
a vector of values, defaults to names(prob) or 1:length(prob), if numeric, the output is numeric
- mu
the mean of x (calculated from x if not given)
- sd
the SD of x (calculated from x if not given)
Examples
x <- rnorm(10000)
y <- norm2likert(x, c(.1, .2, .35, .2, .1, .05))
g <- ggplot2::ggplot() + ggplot2::geom_point(ggplot2::aes(x, y))
ggExtra::ggMarginal(g, type = "histogram")
y <- norm2likert(x, c(40, 30, 20, 10))
g <- ggplot2::ggplot() + ggplot2::geom_point(ggplot2::aes(x, y))
ggExtra::ggMarginal(g, type = "histogram")
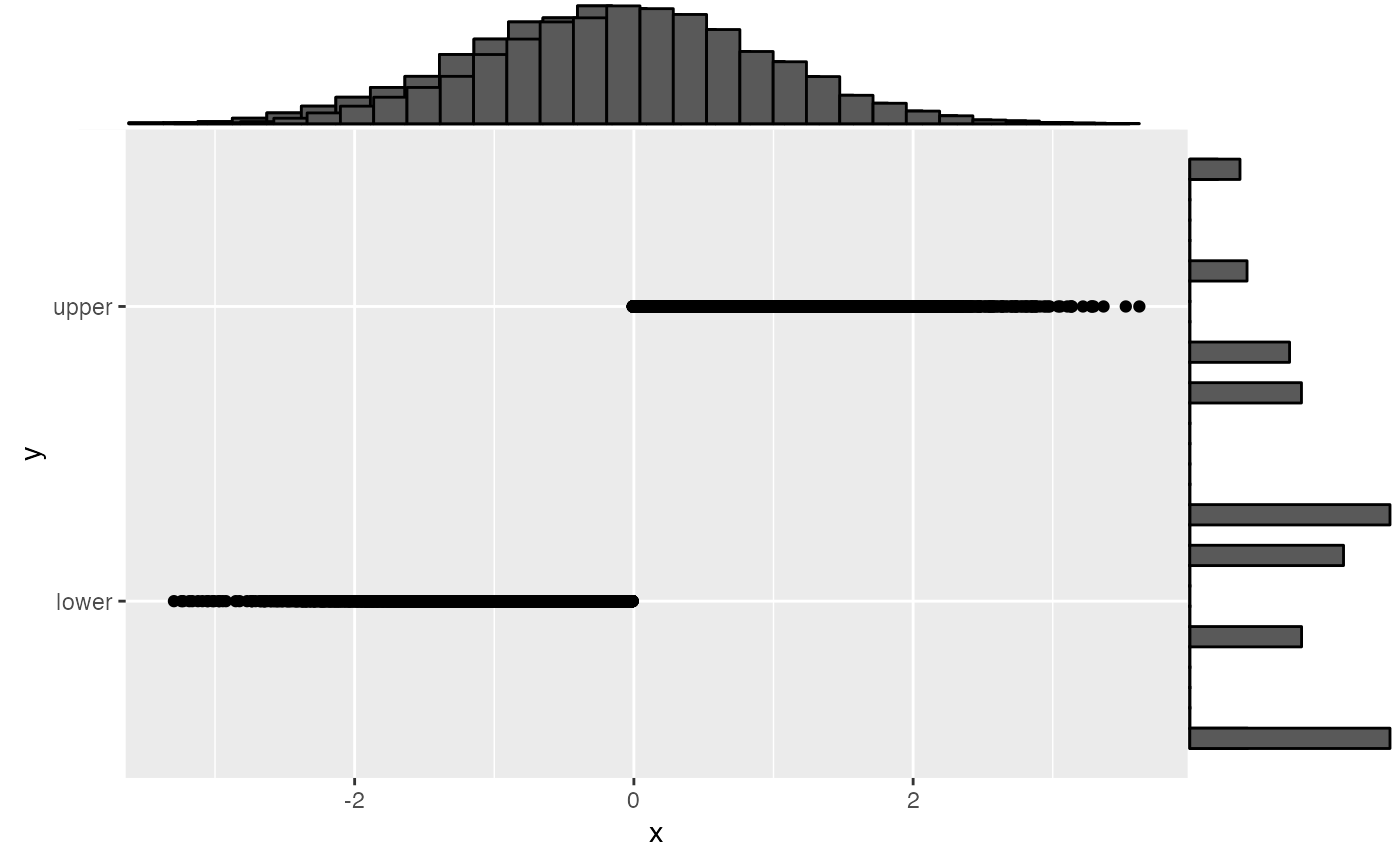
y <- norm2likert(x, c(lower = .5, upper = .5))
g <- ggplot2::ggplot() + ggplot2::geom_point(ggplot2::aes(x, y))
ggExtra::ggMarginal(g, type = "histogram")
#> Warning: NAs introduced by coercion
#> Warning: NAs introduced by coercion
#> Warning: Removed 10000 rows containing non-finite outside the scale range
#> (`stat_bin()`).