10 Experimental
Today I’m going to use faux to generate some simulated data for a factorial experimental design and make some plots.
10.1 Data
The sim_design() function is meant to make the simulation of data for factorial designs easier. You can name the factors and their levels (see extensive vignettes), but here we’ll just use the generic naming from faux and only specify the number of levels of each factor. By default, it simulates 100 observations in each between group, with means of 0 and standard deviations of 1. The function also produces a design plot.
10.1.1 One factor
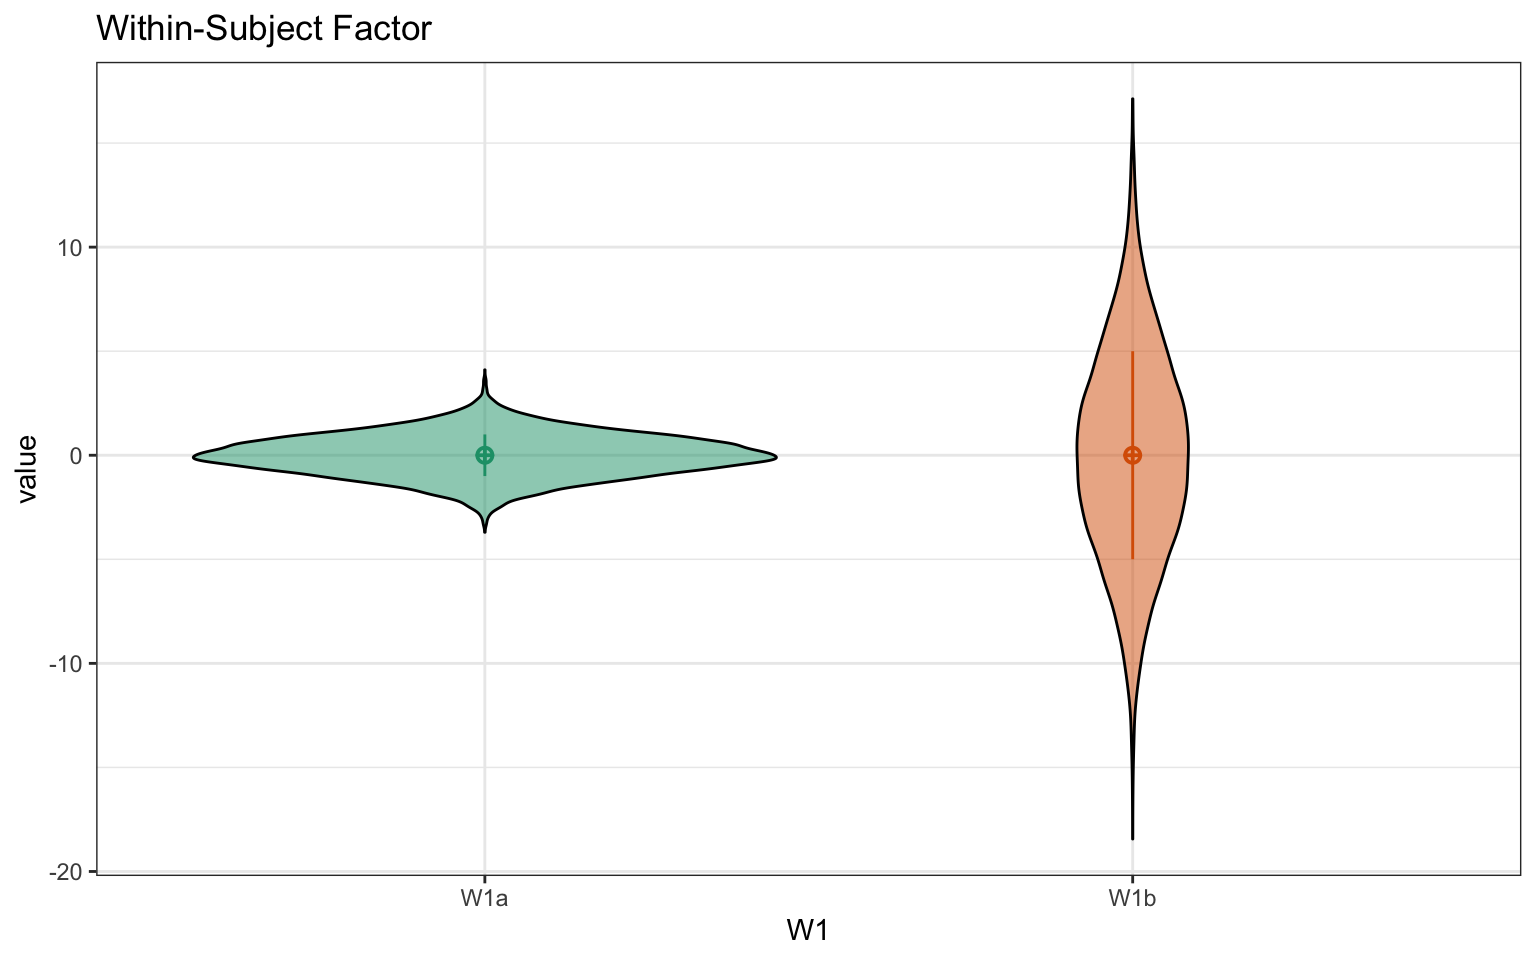
For within-subject designs, you have to specify the correlation between each level. If there are any within factors, the check_sim_stats() table will include the sampled correlations. You can turn off the design plot with plot = FALSE.
10.1.2 Two factors
You can also give the factors names and labels. You can set the correlations separately for each between-subject cell.
Code
# df version uses row and column labels,
# so allows rows and columns to be out of order
mu <- data.frame(cat = c(0, 0.5),
                 dog = c(0.25, 1),
                 row.names = c("am", "pm"))

w2b2 <- sim_design(within = list(time = c("am", "pm")),
                   between = list(pet = c("cat", "dog")),
                   mu = mu,
                   dv = list(y = "Something Score"),
                   r = list(cat = 0,
                            dog = .5),
                   long = TRUE)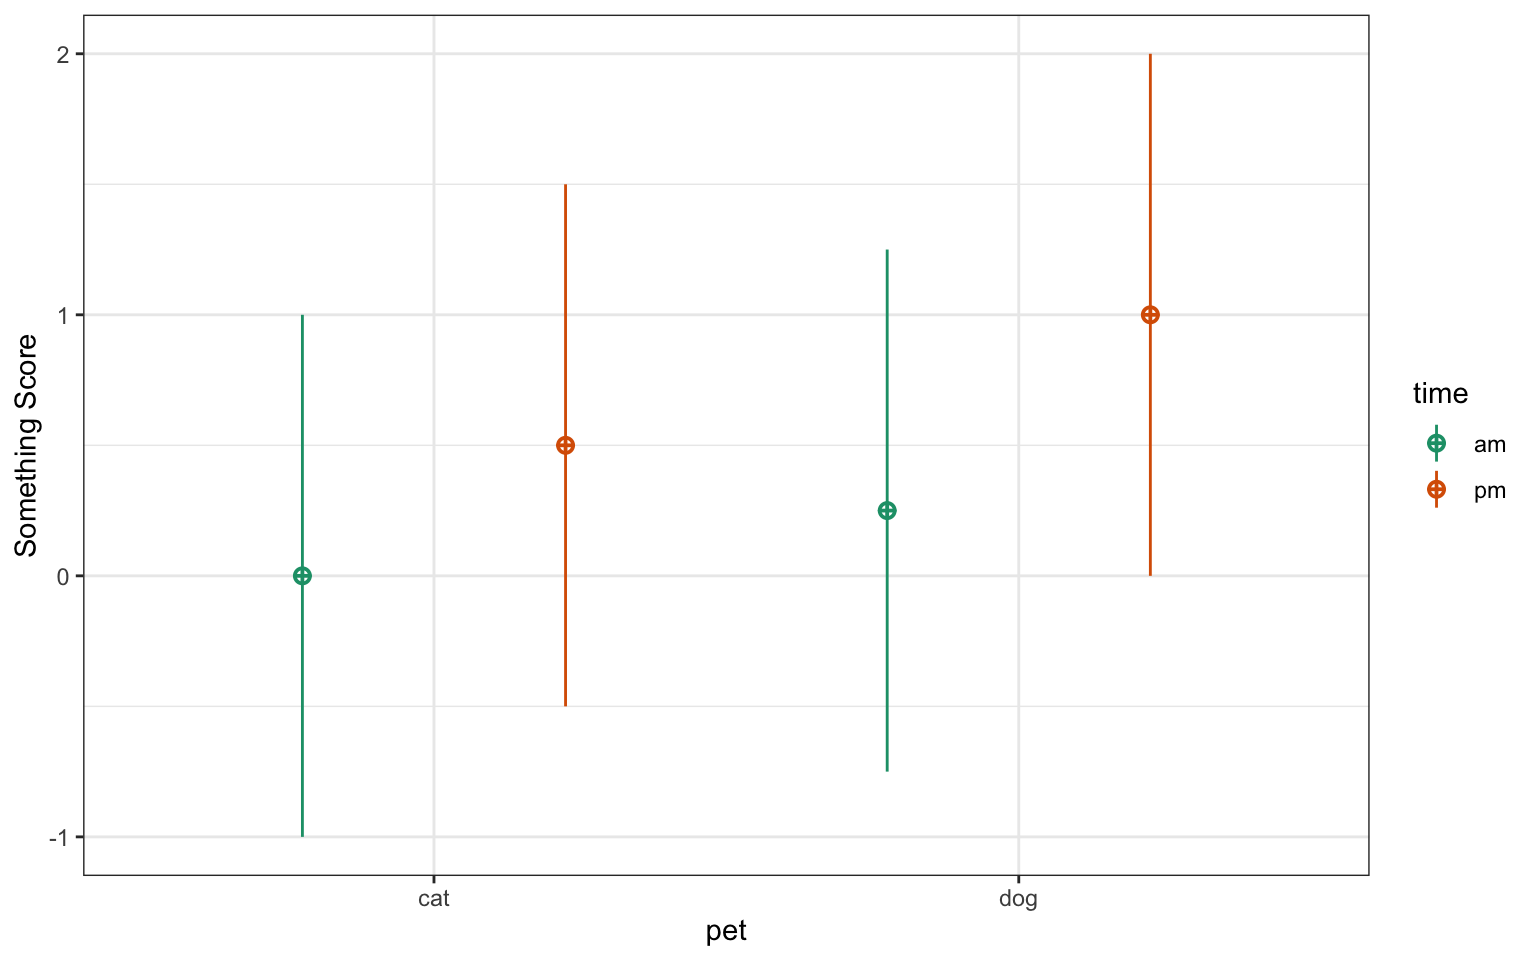
| pet | n | var | am | pm | mean | sd |
|---|---|---|---|---|---|---|
| cat | 100 | am | 1.00 | 0.05 | -0.07 | 1.03 |
| cat | 100 | pm | 0.05 | 1.00 | 0.52 | 0.94 |
| dog | 100 | am | 1.00 | 0.58 | 0.19 | 1.07 |
| dog | 100 | pm | 0.58 | 1.00 | 1.07 | 0.94 |
10.2 Plots
10.2.1 Data Plots
Now it’s time for the fun part: making plots! The plot() function makes it easy to plot data made with faux. See the plotting vignette for more details.
The output is a ggplot, so you can add more ggplot options to it.
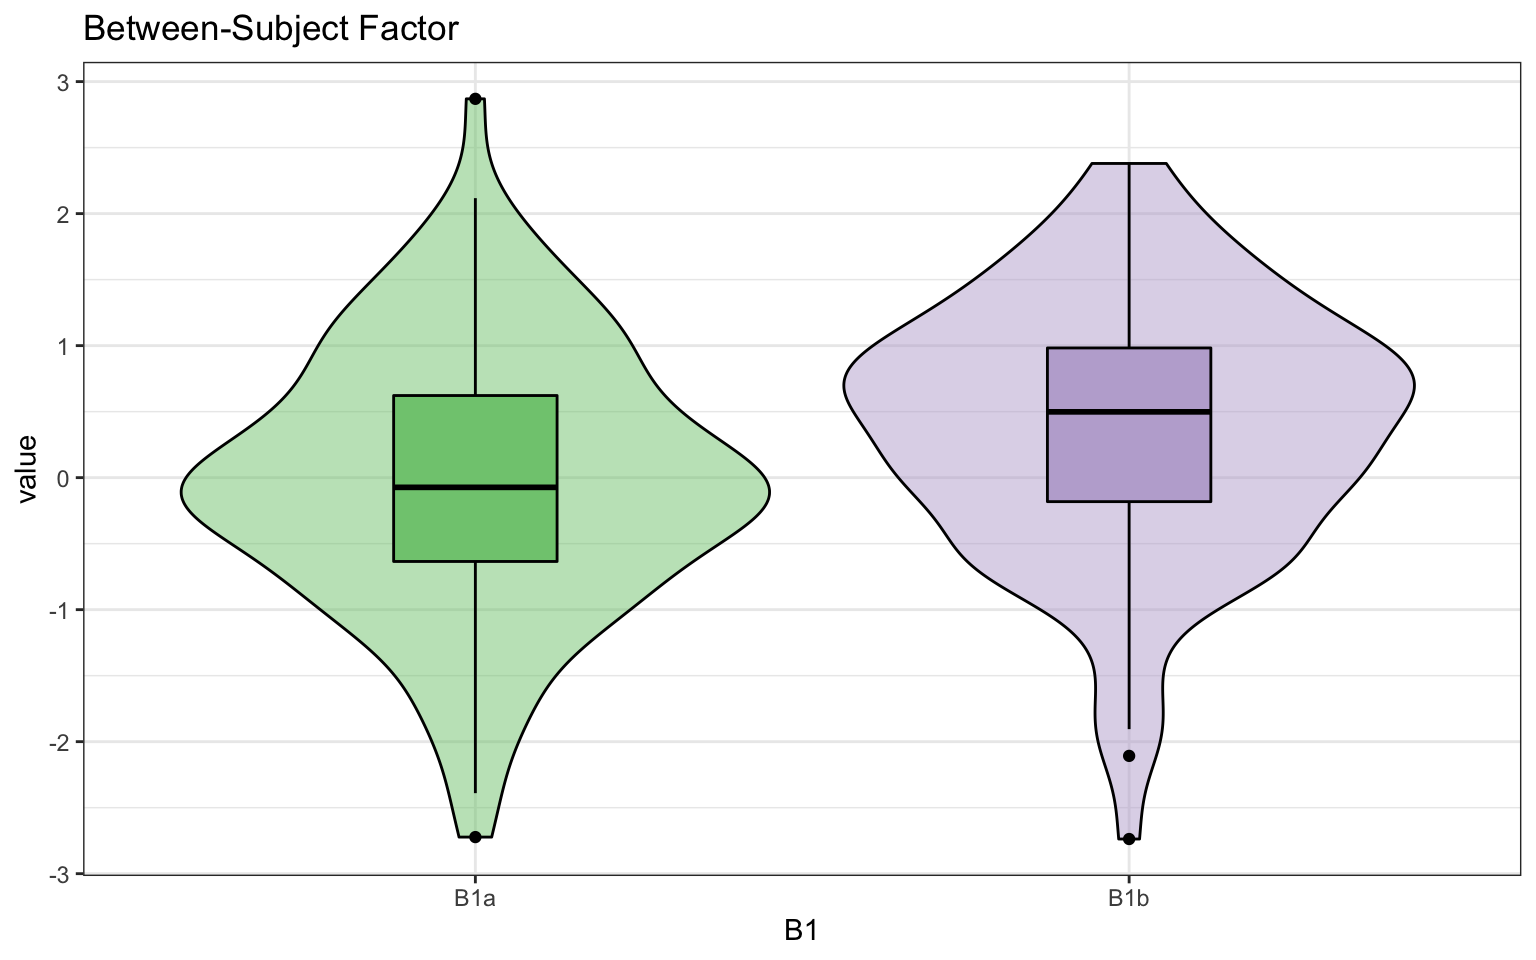
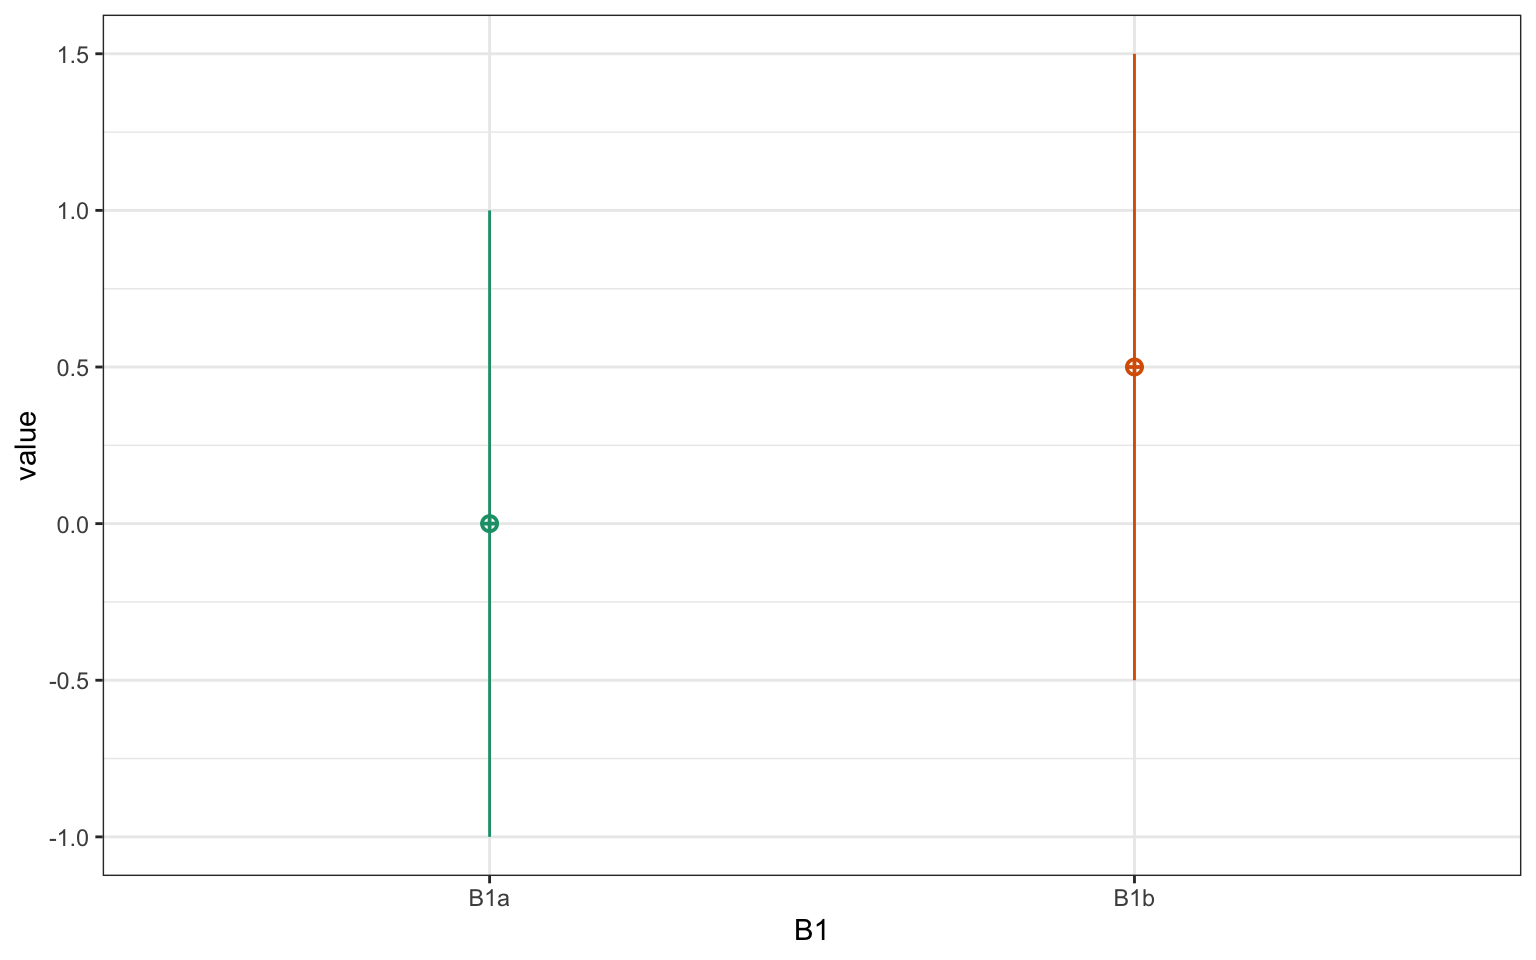
10.2.2 Design Plots
You can also plot the design (not the data). If you plot a violin, the shape will be estimated by simulating a very large sample with these parameters.
10.2.3 Combo Plots
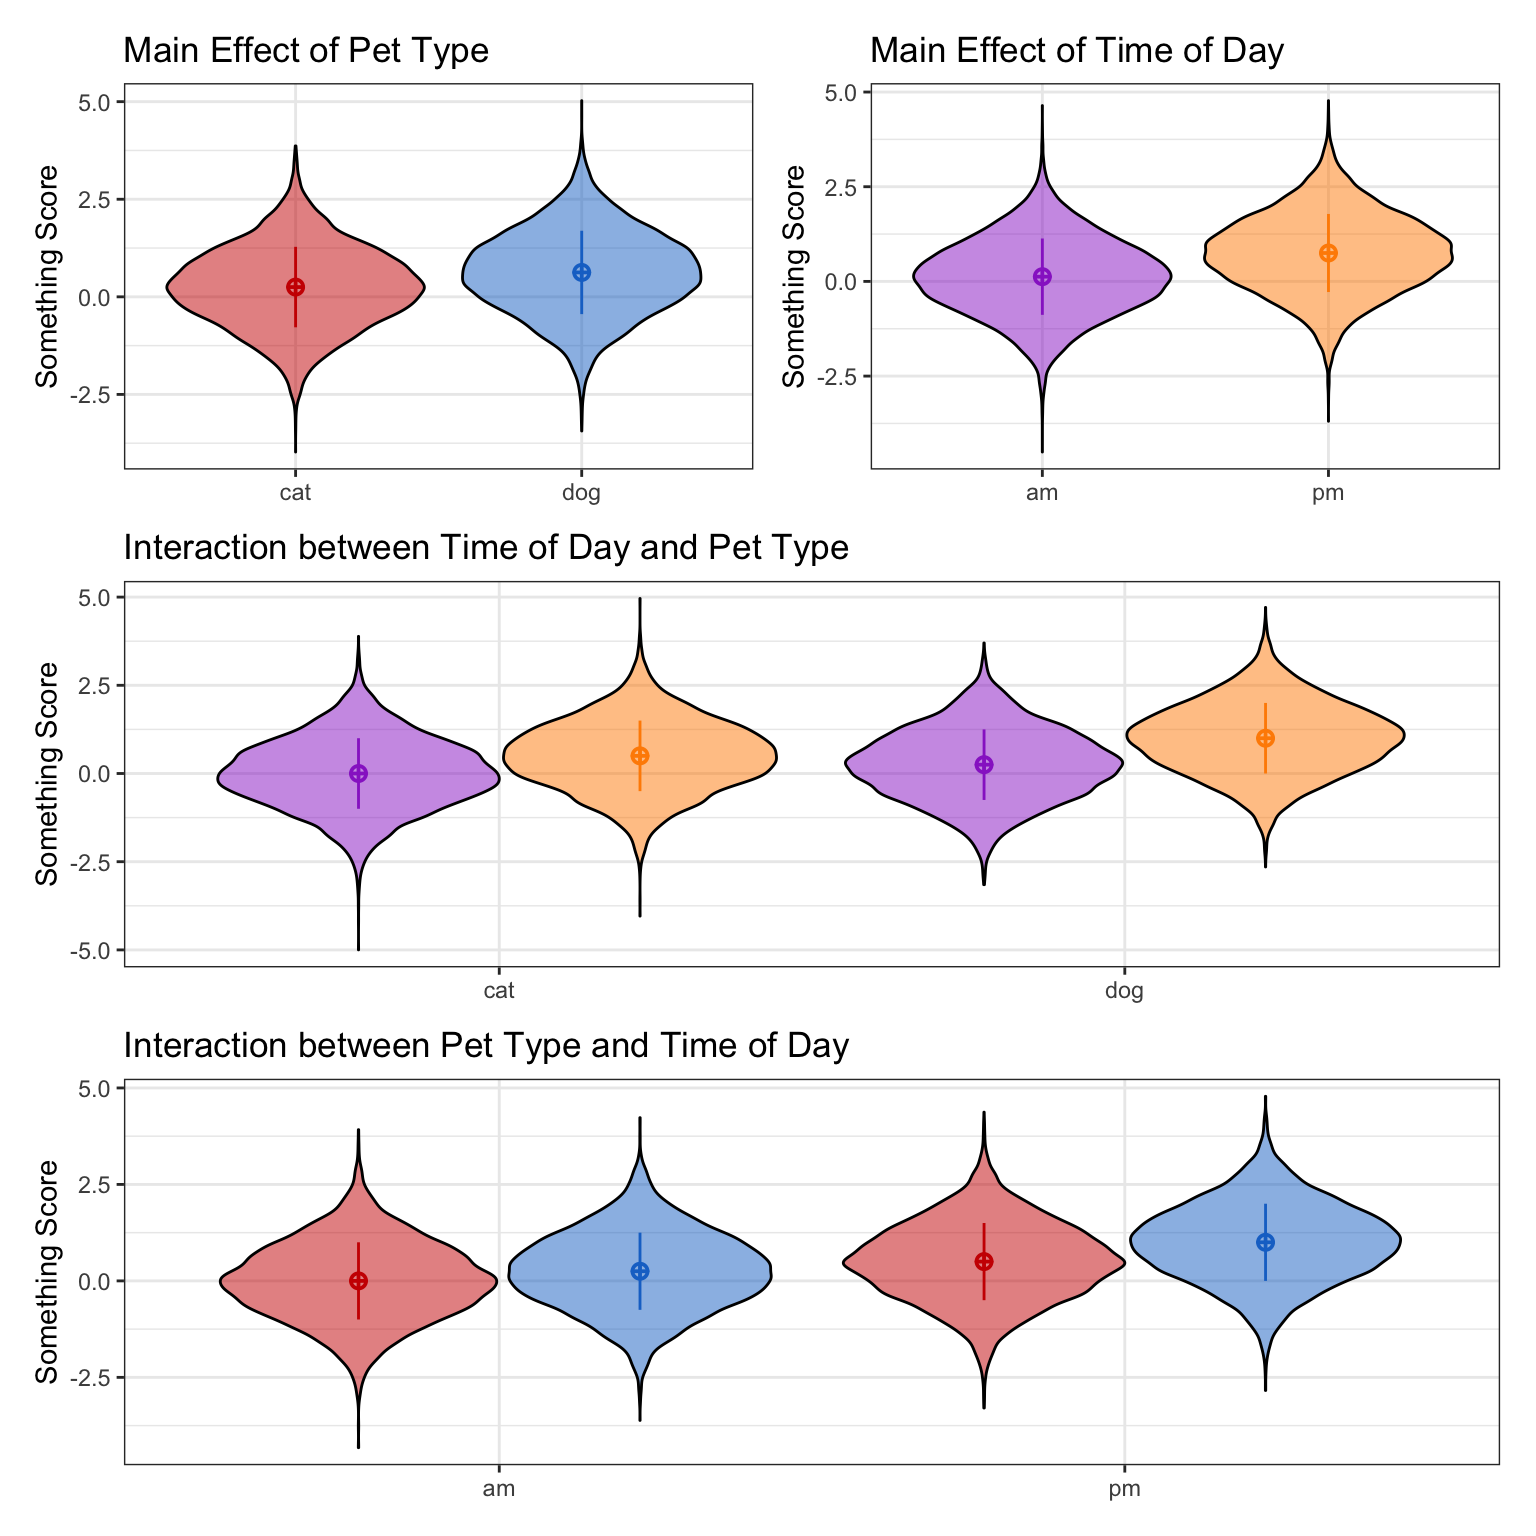
Create a design plot for the main effects and interaction in w2b2. You can specify the order color, x, facet row(s), facet col(s) [this function needs a little work to be more intuitive]. Add a title and custom colours (you’ll get a warning about the duplicate scale for fill; just ignore it).
Code
geoms <- c("violin", "pointrangeSD")
b_colors <- scale_color_manual(values = c("red3", "dodgerblue3"), guide = "none")
w_colors <- scale_color_manual(values = c("darkorchid", "darkorange"), guide = "none")
b_fill <- scale_fill_manual(values = c("red3", "dodgerblue3"), guide = "none")
w_fill <- scale_fill_manual(values = c("darkorchid", "darkorange"), guide = "none")

plot_b2 <- get_design(w2b2) %>%
  plot(geoms = geoms, "pet", "pet") +
  b_colors + b_fill +
  labs(x = NULL, title = "Main Effect of Pet Type")

plot_w2 <- get_design(w2b2) %>%
  plot(geoms = geoms, "time", "time") +
  w_colors + w_fill +
  labs(x = NULL, title = "Main Effect of Time of Day")

plot_w2b2 <- get_design(w2b2) %>%
  plot(geoms = geoms, "time", "pet") +
  w_colors + w_fill +
  labs(x = NULL, title = "Interaction between Time of Day and Pet Type")

plot_b2w2 <- get_design(w2b2) %>%
  plot(geoms = geoms, "pet", "time") +
  b_colors + b_fill +
  labs(x = NULL, title = "Interaction between Pet Type and Time of Day")
Combine with patchwork