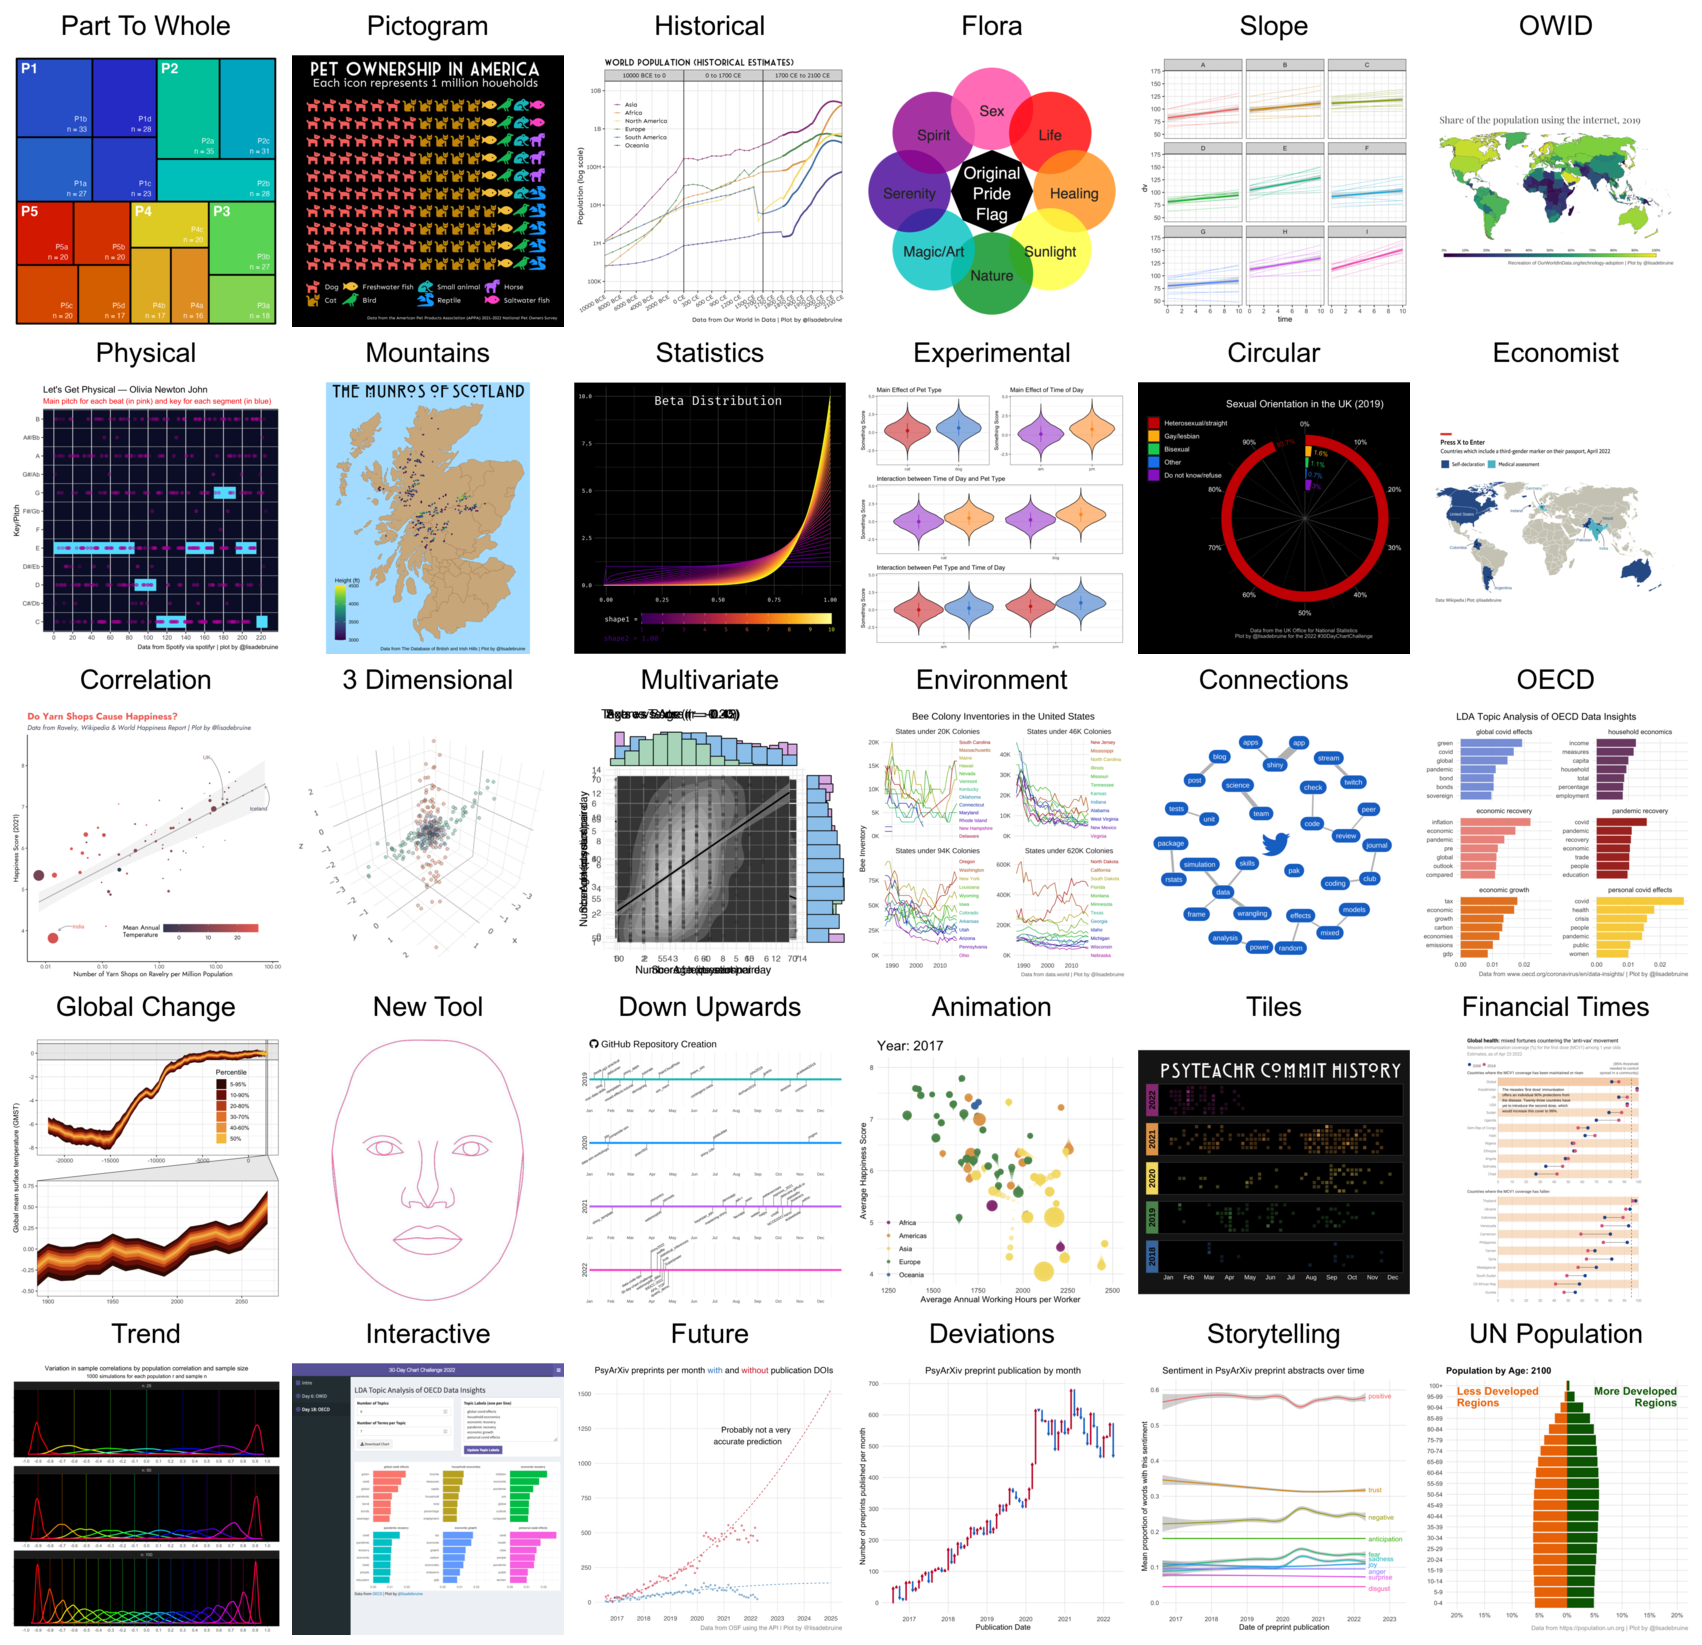
Appendix A — Putting it all together
A.1 Read in images
Read in the images. I named them stupidly, without leading 0s, so am importing them in two batches: the ones with one digit after “day”, then the ones with two digits after “day”.
There are two of “day15”, so I’ll get rid of the first.
A.2 Flatten gifs
Some of the images are animated gifs, so I have to flatten them.
A.3 Resize images
Next, I need to resize the images all to the same size. The to_size() function is a combination of crop(), pad() and resize() that gets all images as large as possible, centered in the image.
A.4 Add labels
Code
chapters <- list.files(".", pattern = "^\\d{2}-.+\\.qmd")
names <- gsub("(^\\d+-|\\.qmd$)", "", chapters)
names <- gsub("-", " ", names) |> stringr::str_to_title()
names[names=="Owid"] <- "OWID"
names[names=="Oecd"] <- "OECD"
names[names=="Un Population"] <- "UN Population"

labelled <- resized %>%
  pad(top = 100, 0, 0, 0) %>%
  label(names, gravity = "north", location = "+0+0")