Appendix C — Stained Glass Heart
I’ve been inspired by a lot of the charts I see on the #30DayChartChallenge hashtag, but Icaro Bernardes` stained glass was the first I wanted to make my own. His original code shows how to create a gorgeous stained-glass window with text. I’ve simplified the code a bit and am just making a heart (using maths) in stained glass.
C.1 Variables
First, set up some variables, like a seed to use for the random elements, the number of points (more will make the glass pieces smaller), and your base palette (I’m using the psyTeachR rainbow colours).
C.2 Frame
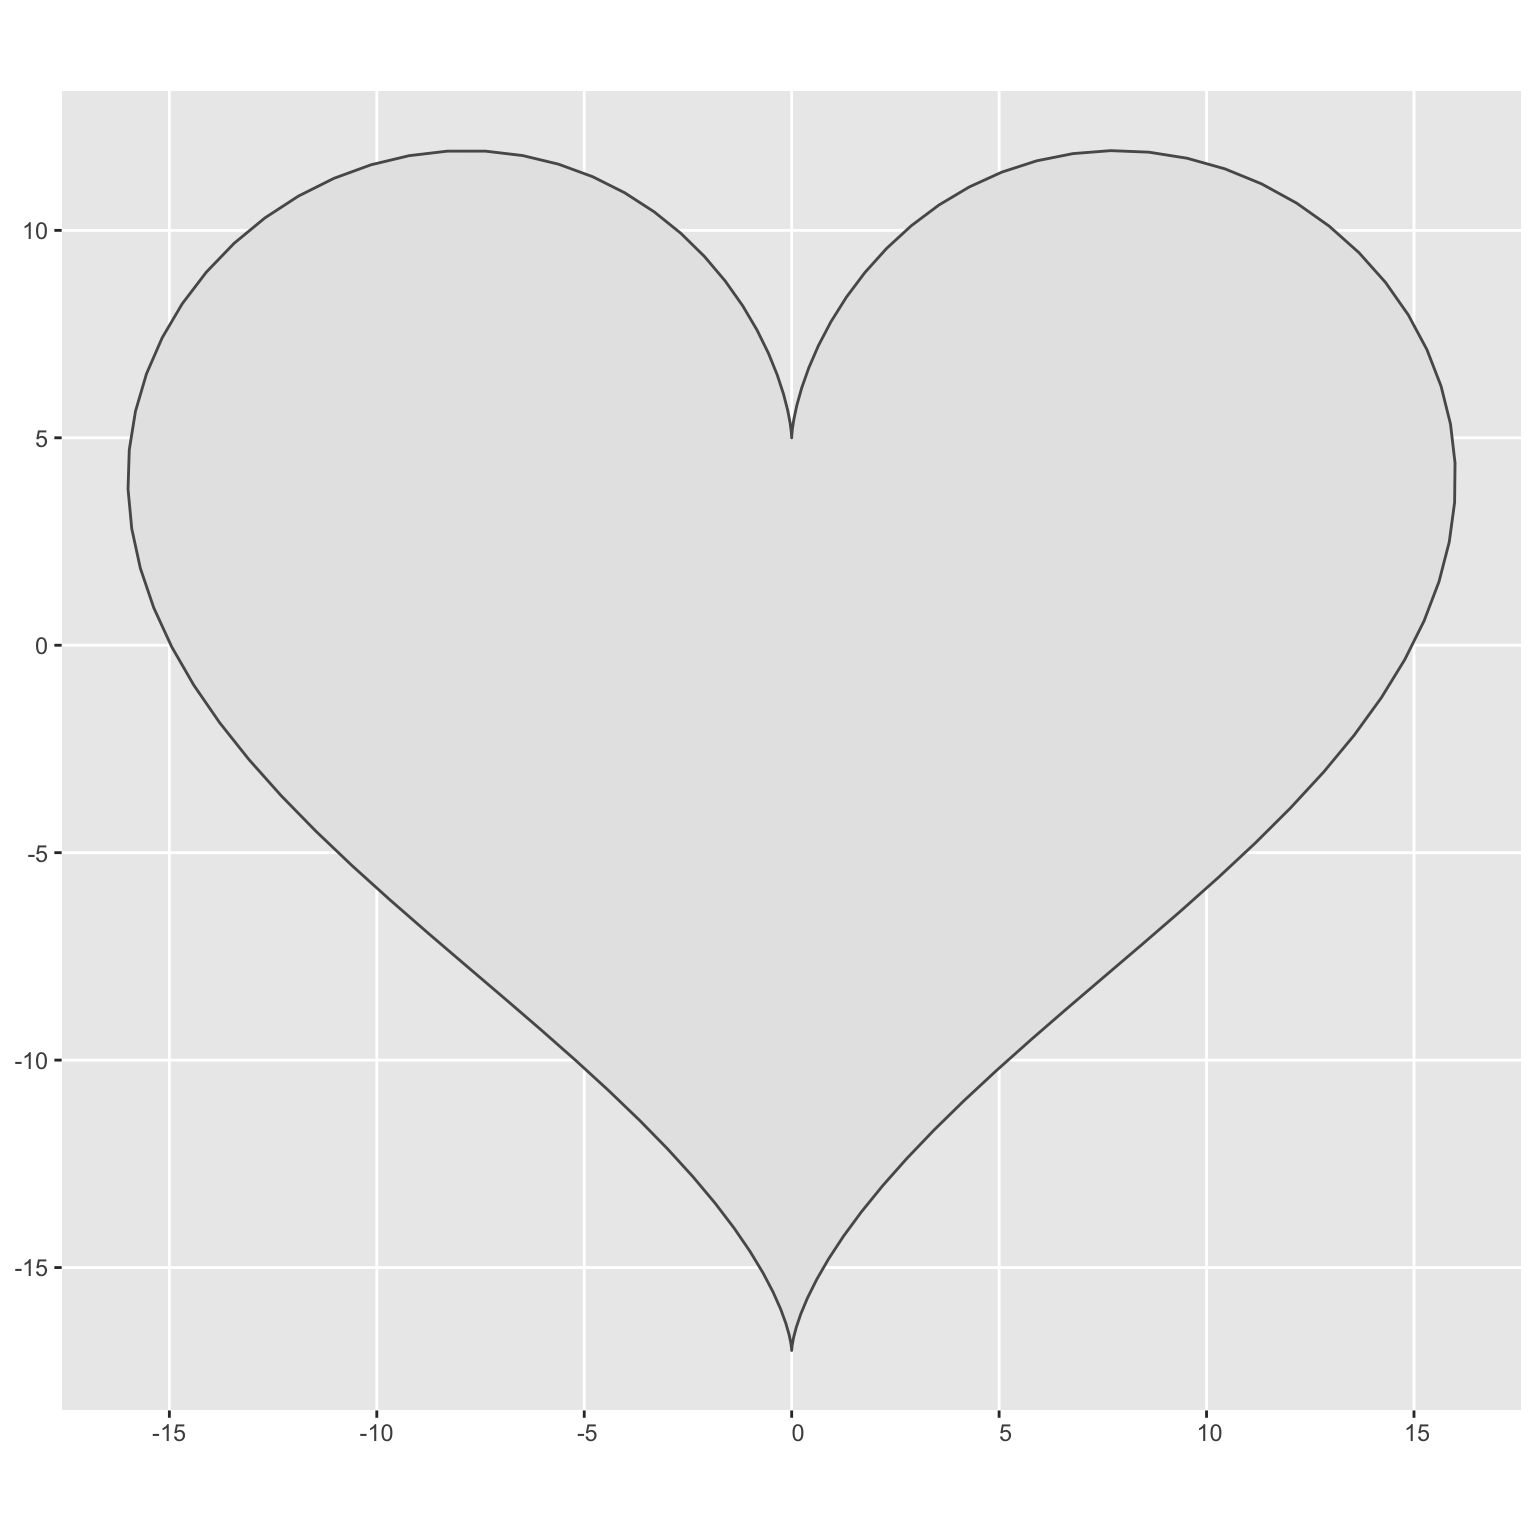
Make a matrix of the x and y coordinates of the frame. The code below is the maths for a heart.
Then convert the matrix to a polygon. Plot to check it looks right.
C.3 Random points
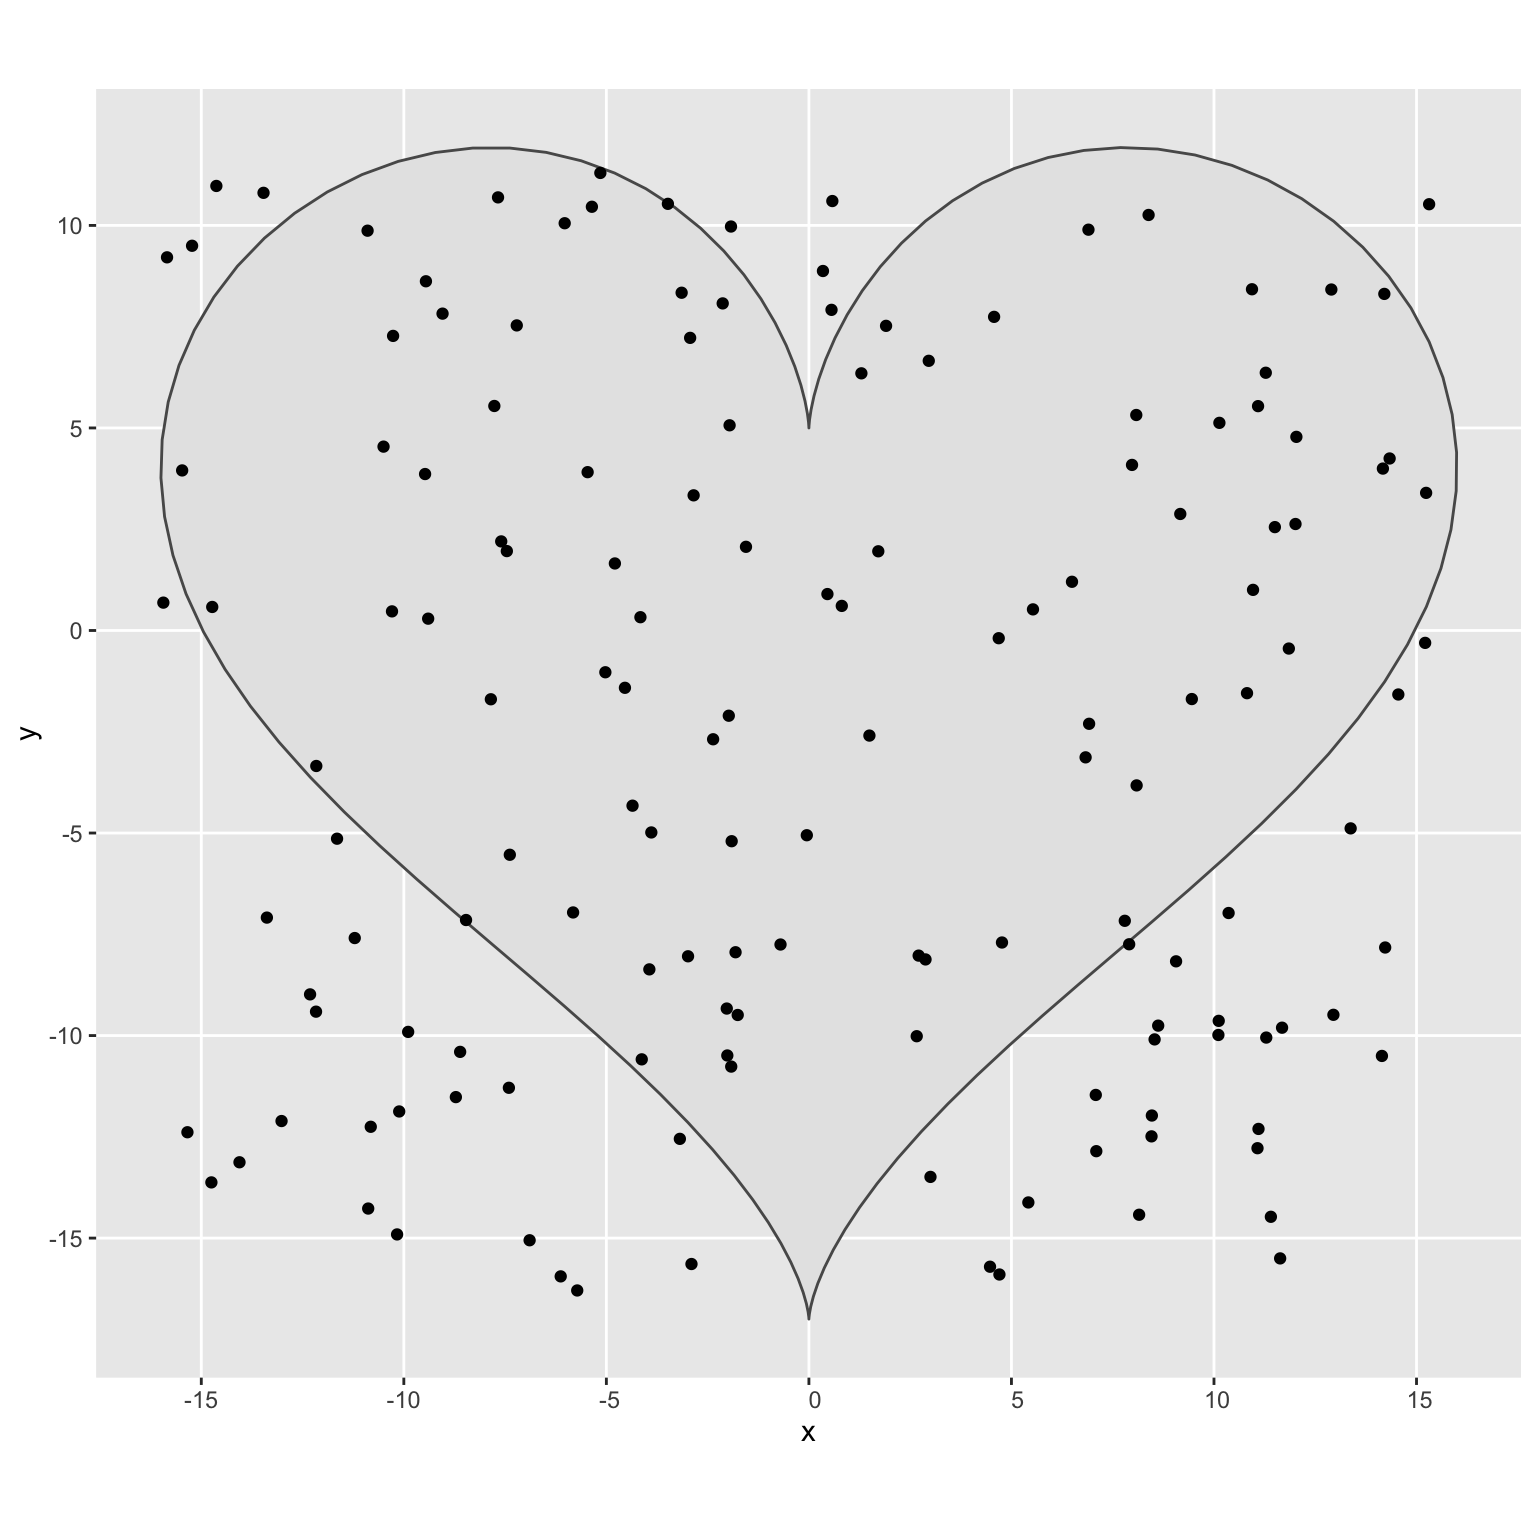
Make some random points within the range of x and y values of the frame.
C.4 Constrain points
Constrain the points to just those inside the frame. Do this by creating an sf version of the points, then using sf::st_contains() to check which are contained in the frame sf object. Then, select just the contained points from the points table.
constrain points
## Creates a new sf object to hold the created points
points_sf <- sf::st_as_sf(points, coords = c("x","y"))

## Keeps only the random points that are within the frame
contained <- sf::st_contains(frame_sf, points_sf)
points <- points %>% dplyr::slice(contained[[1]])

# plot to check
ggplot() +
  geom_sf(data = frame_sf) +
  geom_point(aes(x, y), points)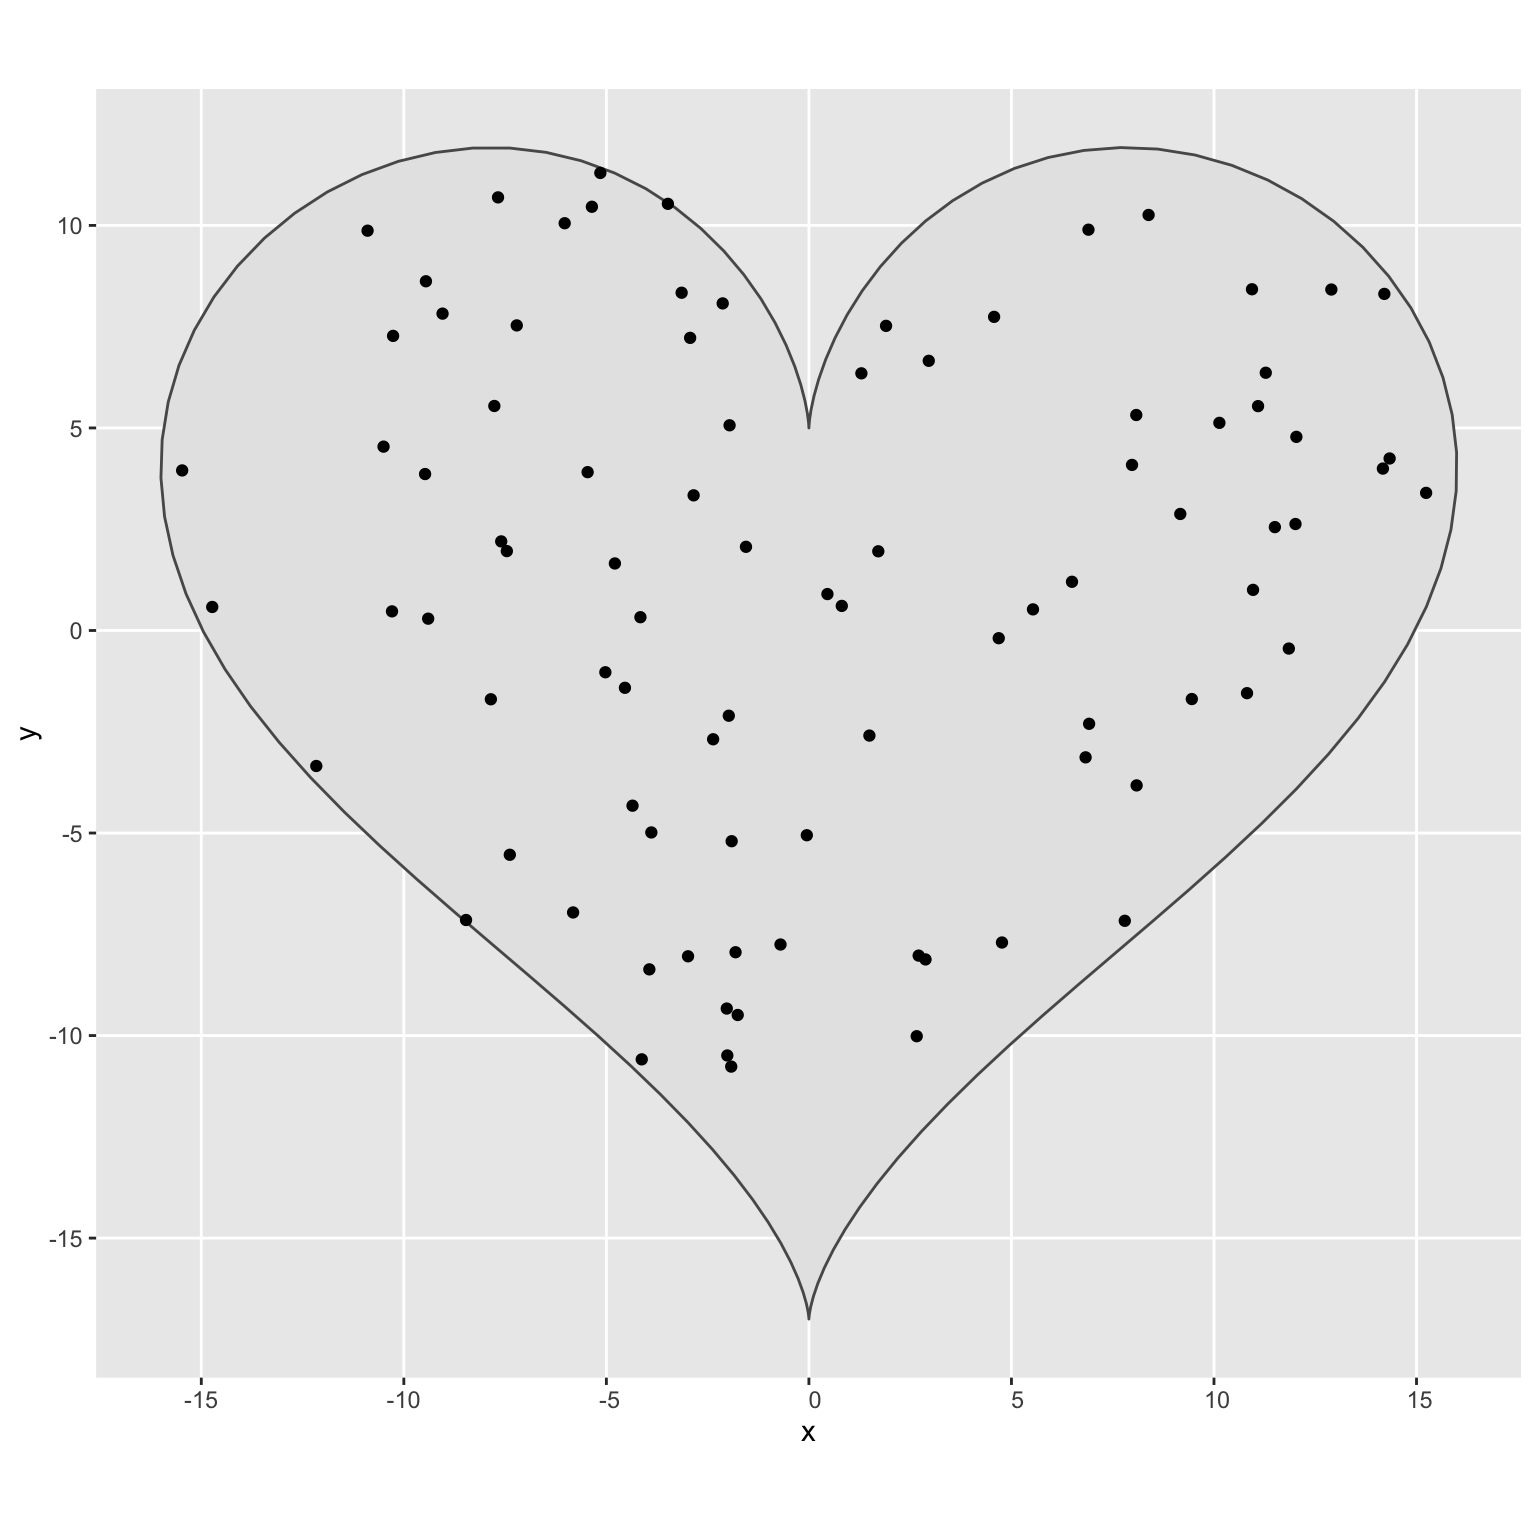
C.5 Pane colours
Add to the points table a column called fill with randomly sampled colours from the paletteand a column calledalpha` with randomly sampled values between 0.2 and 0.9. You can change these to make your window more or less transparent.
C.6 Plot
Now plot! Note the I() function for fill and alpha, which uses the actual value in these columns, instead of mapping new values to each unique value.
Plot
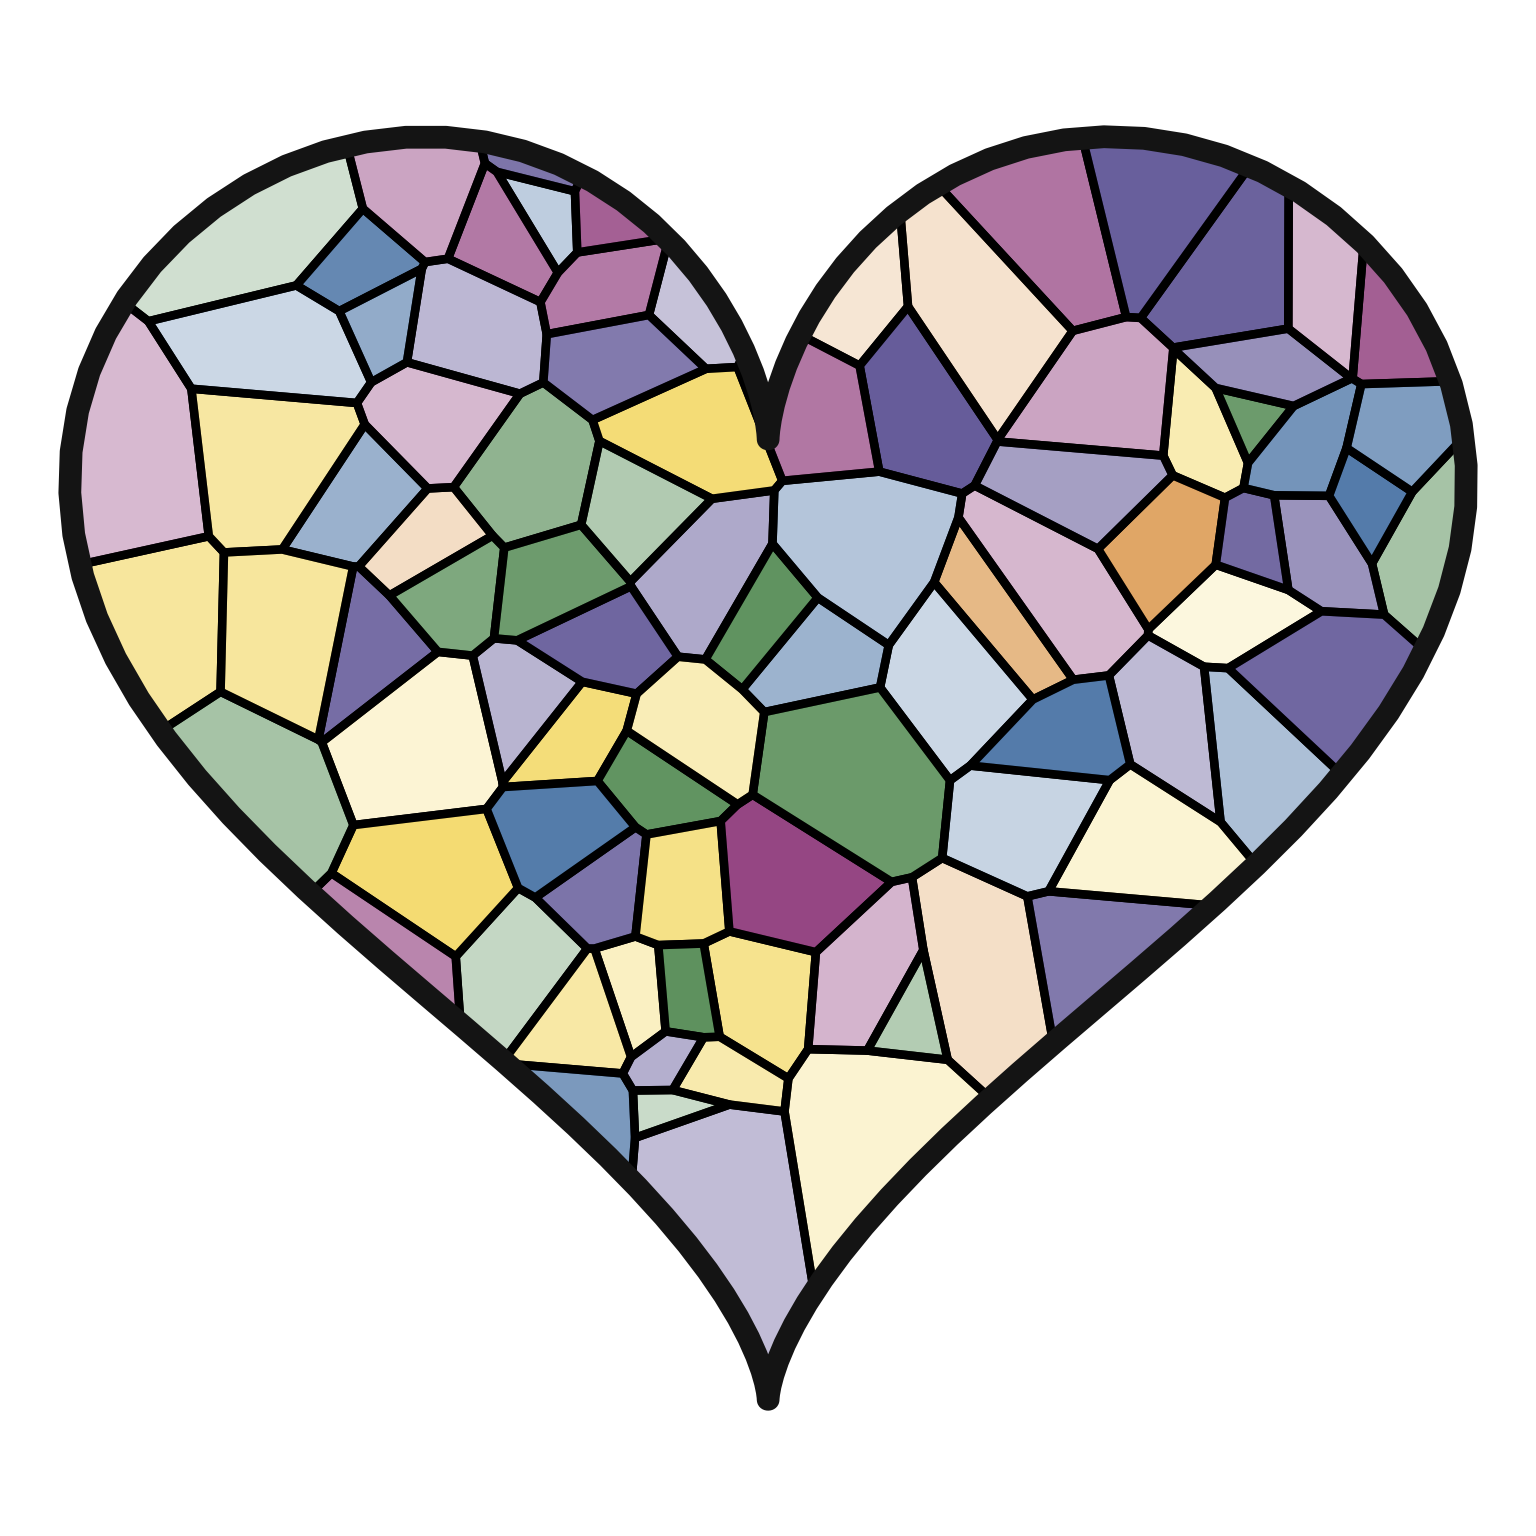
I like it even better with a black background.